Gantt Suite lets you track the resource workloads, availability and highlights the present resource overloads. Resources panel is located at the bottom of the chart. It shows the list of all resources assignable to chart project (s)tasks.
...
Each resource line show shows a resource name, and total assigned workload at the left. The right side shows workload by day/week/month/etc., depending on the selected chart time scale.
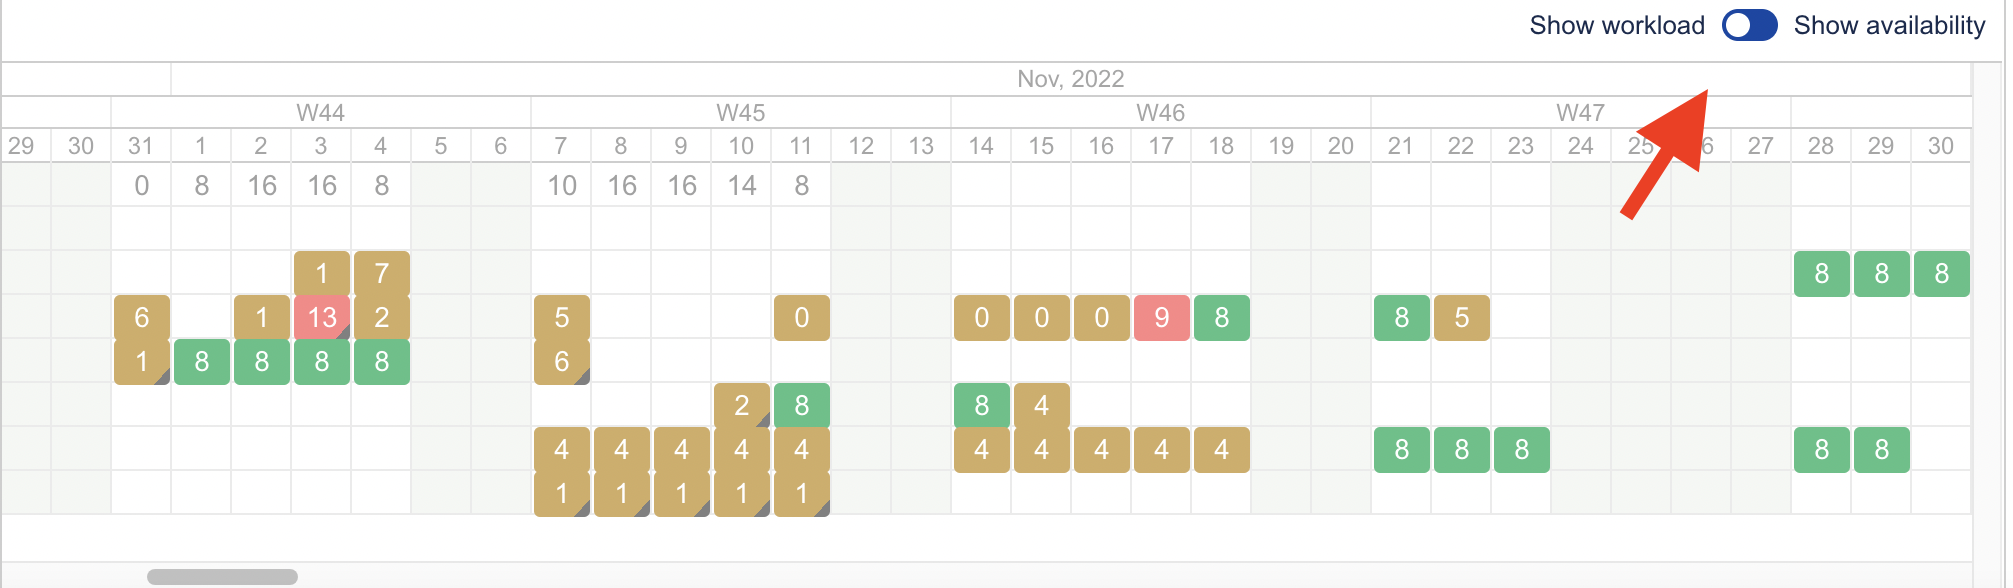
On the right, there is a switcher between resource workload and availability.
 |
The first resource line is always Unassigned. All the unassigned work gets summarized and shown in this line.
Resource In workload mode, a resource cell color can be:
green - assigned workload is less or equal to resource capacity
yellow - assigned workload is leed that resource capacity
red - resource is overloaded
In availability mode, a resource cell color can be:
green - resource availability is used fully
yellow - resource has available time left and can be assigned more tasks
red - resource has no time available as he or she is overloaded
Gantt Suite marks a resource as overloaded if number of assigned working hours for a day is bigger than number of working hours specified in chart configuration. This rule does not depend on a selected scale. So, for example, if selected scales is a month and app shows overload - it means a resource has overload in at least one day of the month.
...