Gantt Suite lets you track the resource workloads, availability and highlights present resource overloads. Resources panel is located at the bottom of the chart. It shows the list of all resources assignable to chart project tasks.
...
In workload mode, a resource cell color can be:
green - assigned workload is equal to resource capacity
yellow - assigned workload is leed that resource capacity
red - resource is overloaded
In availability mode, a resource cell color can be:
green - resource availability is used fully
yellow - resource has available time left and can be assigned more tasks
red - resource has no time available as he or she is overloaded
...
| Info |
|---|
Resource workload calculation can slow down chart operations. It is recommended to hide resources when not actually needed, or if you experience a significant slow down. |
| Tip |
|---|
If needed, the Resource panel can be hidden from a Gantt chart display for good, in chart configuration. |
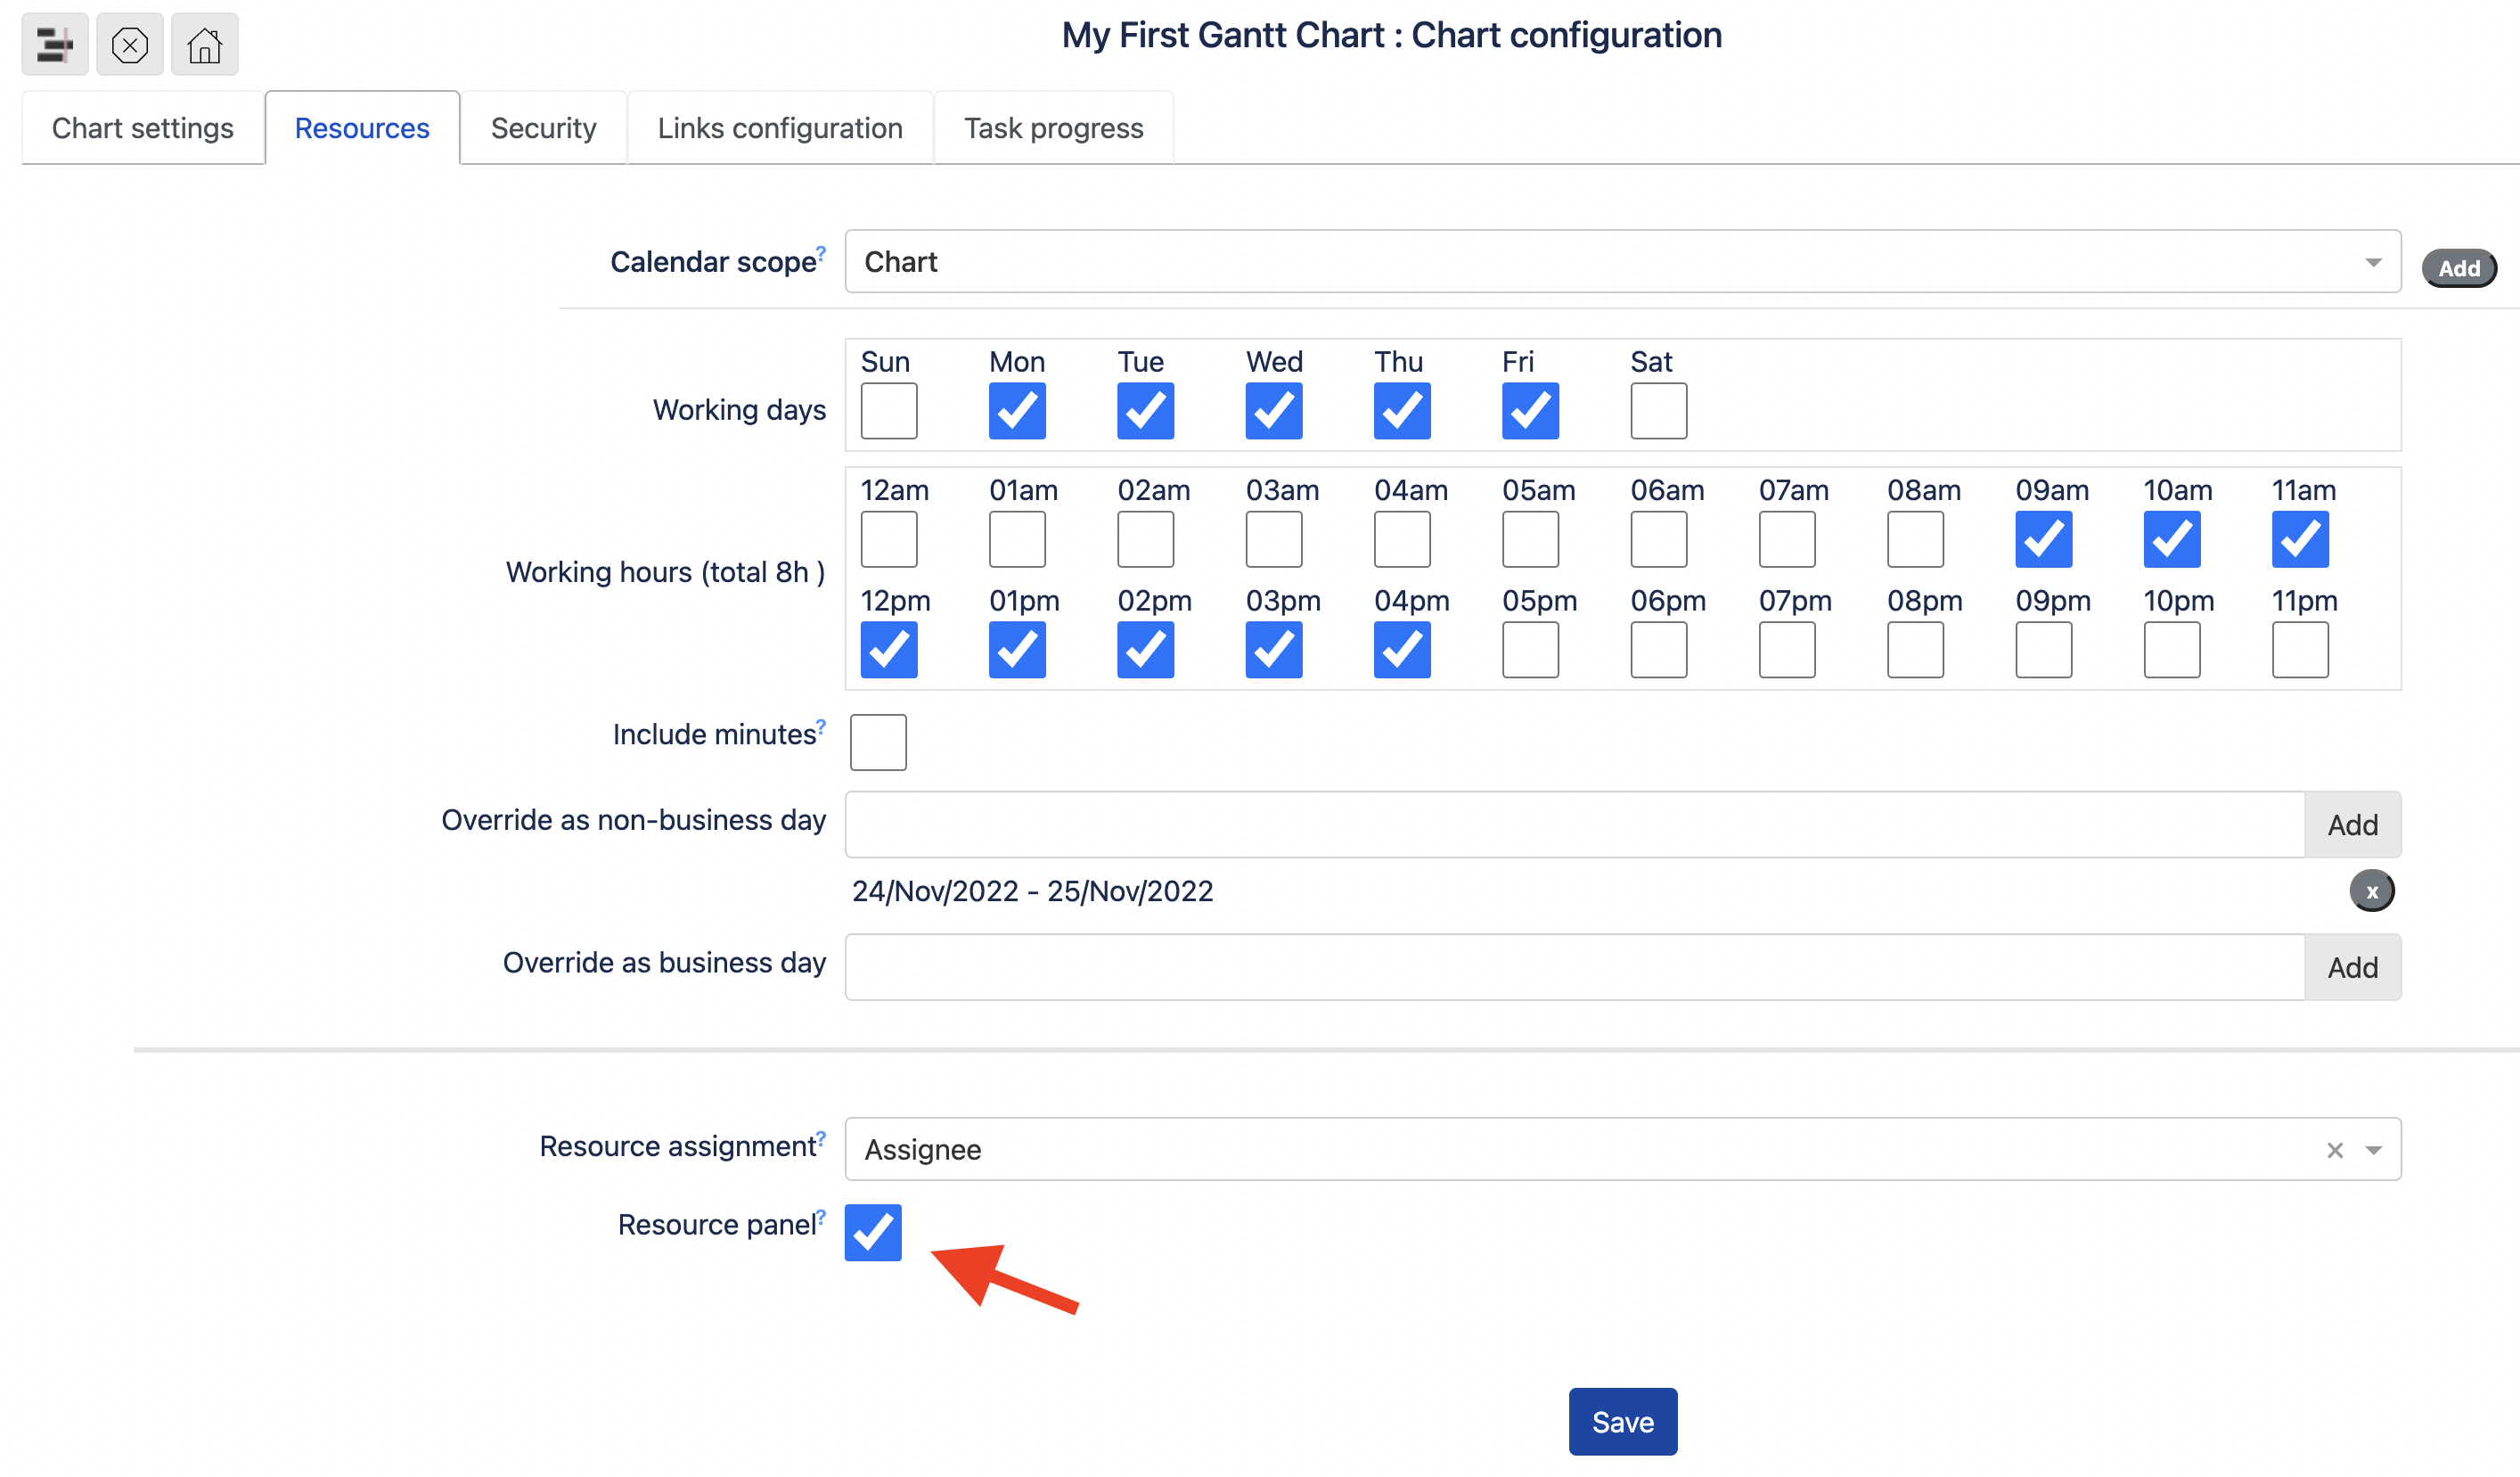 |