Sometimes, it's better to display data as charts and you can easily do it by using one of JavaScript charting libraries. Chart.js is the perfect choice.
...
| Code Block | ||
|---|---|---|
| ||
define("_ujgCompletedIssues", [ "jquery" ], function($) {
  var MyGadget = function(API) {
    var $msgDiv = $("#comp-issues-cont"); // find attached DOM element
    API.getGadgetContentEl().append($msgDiv);
    // function to call from success ajax callbacks
    var showInfo = function(todo, completed, total) {
      if (todo !== undefined && completed !== undefined && total !== undefined) { // only if 3 vars are defined
        var other = total - completed - todo;
        // Chart.js magic
        new Chart($msgDiv.find("canvas").get(0), {
          type: 'pie',
          data: {
            labels: ["To Do", "Completed", "Other"],
            datasets: [{
              label: '# of Issues',
              data: [todo, completed, other],
              backgroundColor: [
                'rgba(255, 0, 0, 0.7)',
                'rgba(0, 255, 0, 0.7)',
                'rgba(0, 0, 255, 0.7)'
              ]
            }]
          }
        });
        $msgDiv.find("span").append('To Do: ' + todo + '</br>' + 'Completed: ' + completed + '</br>' + 'Other: ' + other);
        API.resize();
      }
    };
    // function for error displaying
    var showError = function(url) {
      $msgDiv.empty();
      AJS.messages['error']($msgDiv, {
        title : 'Error!',
        body : 'Failed to retrieve data for URL: ' + url
      });
      API.resize();
    };
    var url, todo, completed, total; // initially are undefined
    url = 'https://vkrupach.atlassian.net/rest/agile/1.0/board/6/issue?jql=sprint%20in%20openSprints()%20and%20status%20in(%27To%20Do%27)&fields=id';
    // make a call for number of completed issues
    // $.ajax({ // for Server
    AP.request({ // for Cloud
      url : url,
      success : function(data) {
        // todo = data.total; // for Server
        todo = $.parseJSON(data).total; // for Cloud
        showInfo(todo, completed, total); // call it 3 times since ajax methods are asynchronous and we are not sure about thier completion order
      },
      error : function(data) {
        showError(url);
      }
    });
    url = 'https://vkrupach.atlassian.net/rest/agile/1.0/board/6/issue?jql=sprint%20in%20openSprints()%20and%20status%20in(Done)&fields=id';
    // make a call for number of completed issues
    // $.ajax({ // for Server
    AP.request({ // for Cloud
      url : url,
      success : function(data) {
        // completed = data.total; // for Server
        completed = $.parseJSON(data).total; // for Cloud
        showInfo(todo, completed, total); // call it 3 times since ajax methods are asynchronous and we are not sure about thier completion order
      },
      error : function(data) {
        showError(url);
      }
    });
    url = 'https://vkrupach.atlassian.net/rest/agile/1.0/board/6/issue?jql=sprint%20in%20openSprints()&fields=id';
    // $.ajax({ // for Server
    AP.request({ // for Cloud
      url : url,
      success : function(data) {
        // total = data.total; // for Server
        total = $.parseJSON(data).total; // for Cloud
        showInfo(todo, completed, total); // call it 3 times since ajax methods are asynchronous and we are not sure about thier completion order
      },
      error : function(data) {
        showError(url);
      }
    });
  };
  return MyGadget;
}); |
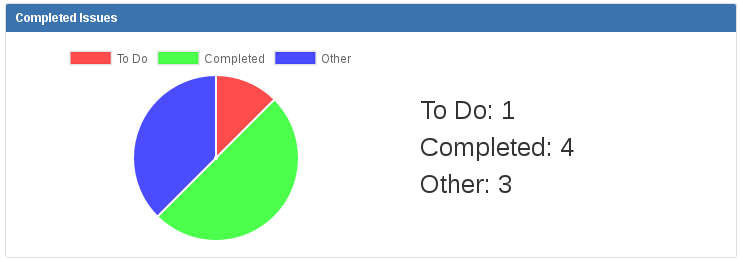
Result is As result, we have a beautiful and colorful chart: