Optional: Add charts
- Volodymyr Krupach
- Mariia Korolishyna
- Volodymyr Krupach
Owned by Volodymyr Krupach
Sometimes, it's better to display data as charts and you can easily do it by using one of JavaScript charting libraries. Chart.js is the perfect choice.
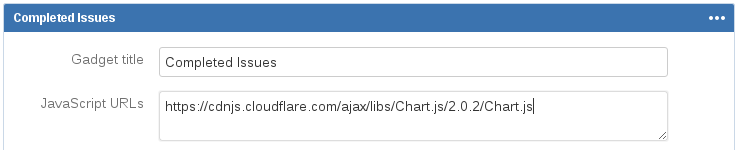
Add Chart.js CDN URL to "JavaScript URLs":
Add HTML to "HTML to append" editor:
<div id="comp-issues-cont" style="padding:10px;">
  <canvas style="max-width:400px; max-height:400px;" />
  <span style="display: inline-block; vertical-align: top; padding-top: 40px; font-size: 26px;" />
</div>
We are going to improve the JavaScript:
- To fetch number of issues in To Do status
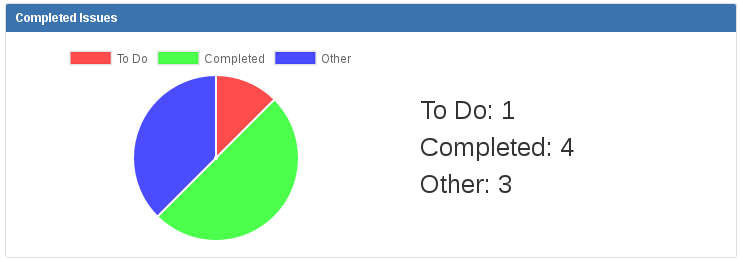
- To display a pie chart that shows number of issues in To Do, Completed and Other statuses
define("_ujgCompletedIssues", [ "jquery" ], function($) {
  var MyGadget = function(API) {
    var $msgDiv = $("#comp-issues-cont"); // find attached DOM element
    API.getGadgetContentEl().append($msgDiv);
    // function to call from success ajax callbacks
    var showInfo = function(todo, completed, total) {
      if (todo !== undefined && completed !== undefined && total !== undefined) { // only if 3 vars are defined
        var other = total - completed - todo;
        // Chart.js magic
        new Chart($msgDiv.find("canvas").get(0), {
          type: 'pie',
          data: {
            labels: ["To Do", "Completed", "Other"],
            datasets: [{
              label: '# of Issues',
              data: [todo, completed, other],
              backgroundColor: [
                'rgba(255, 0, 0, 0.7)',
                'rgba(0, 255, 0, 0.7)',
                'rgba(0, 0, 255, 0.7)'
              ]
            }]
          }
        });
        $msgDiv.find("span").append('To Do: ' + todo + '</br>' + 'Completed: ' + completed + '</br>' + 'Other: ' + other);
        API.resize();
      }
    };
    // function for error displaying
    var showError = function(url) {
      $msgDiv.empty();
      AJS.messages['error']($msgDiv, {
        title : 'Error!',
        body : 'Failed to retrieve data for URL: ' + url
      });
      API.resize();
    };
    var url, todo, completed, total; // initially are undefined
    url = 'https://vkrupach.atlassian.net/rest/agile/1.0/board/6/issue?jql=sprint%20in%20openSprints()%20and%20status%20in(%27To%20Do%27)&fields=id';
    // make a call for number of completed issues
    // $.ajax({ // for Server
    AP.request({ // for Cloud
      url : url,
      success : function(data) {
        // todo = data.total; // for Server
        todo = $.parseJSON(data).total; // for Cloud
        showInfo(todo, completed, total); // call it 3 times since ajax methods are asynchronous and we are not sure about thier completion order
      },
      error : function(data) {
        showError(url);
      }
    });
    url = 'https://vkrupach.atlassian.net/rest/agile/1.0/board/6/issue?jql=sprint%20in%20openSprints()%20and%20status%20in(Done)&fields=id';
    // make a call for number of completed issues
    // $.ajax({ // for Server
    AP.request({ // for Cloud
      url : url,
      success : function(data) {
        // completed = data.total; // for Server
        completed = $.parseJSON(data).total; // for Cloud
        showInfo(todo, completed, total); // call it 3 times since ajax methods are asynchronous and we are not sure about thier completion order
      },
      error : function(data) {
        showError(url);
      }
    });
    url = 'https://vkrupach.atlassian.net/rest/agile/1.0/board/6/issue?jql=sprint%20in%20openSprints()&fields=id';
    // $.ajax({ // for Server
    AP.request({ // for Cloud
      url : url,
      success : function(data) {
        // total = data.total; // for Server
        total = $.parseJSON(data).total; // for Cloud
        showInfo(todo, completed, total); // call it 3 times since ajax methods are asynchronous and we are not sure about thier completion order
      },
      error : function(data) {
        showError(url);
      }
    });
  };
  return MyGadget;
});
As result, we have a beautiful and colorful chart: