...
Gantt Suite home page shows a list of charts created by you and shared with you.
...
 |
Chart configuration
Chart configuration defines the items to include on a chart, work time specifics for the chart, as well as security and sharing.
...
Chart settings mostly define what data to include into a chart. The ‘Chart settings’ tab includes two sections, General and Additional.
...
...
To be more precise, the Chart settings tab provides the ability to define the General information such as chart name, description and start/end dates, the Scheduling options such as type of Scheduling, project/project boards, JQL filter and scheduling mode, and the Task options such as start/end field, deadline field, duration calculation and mode.
 |
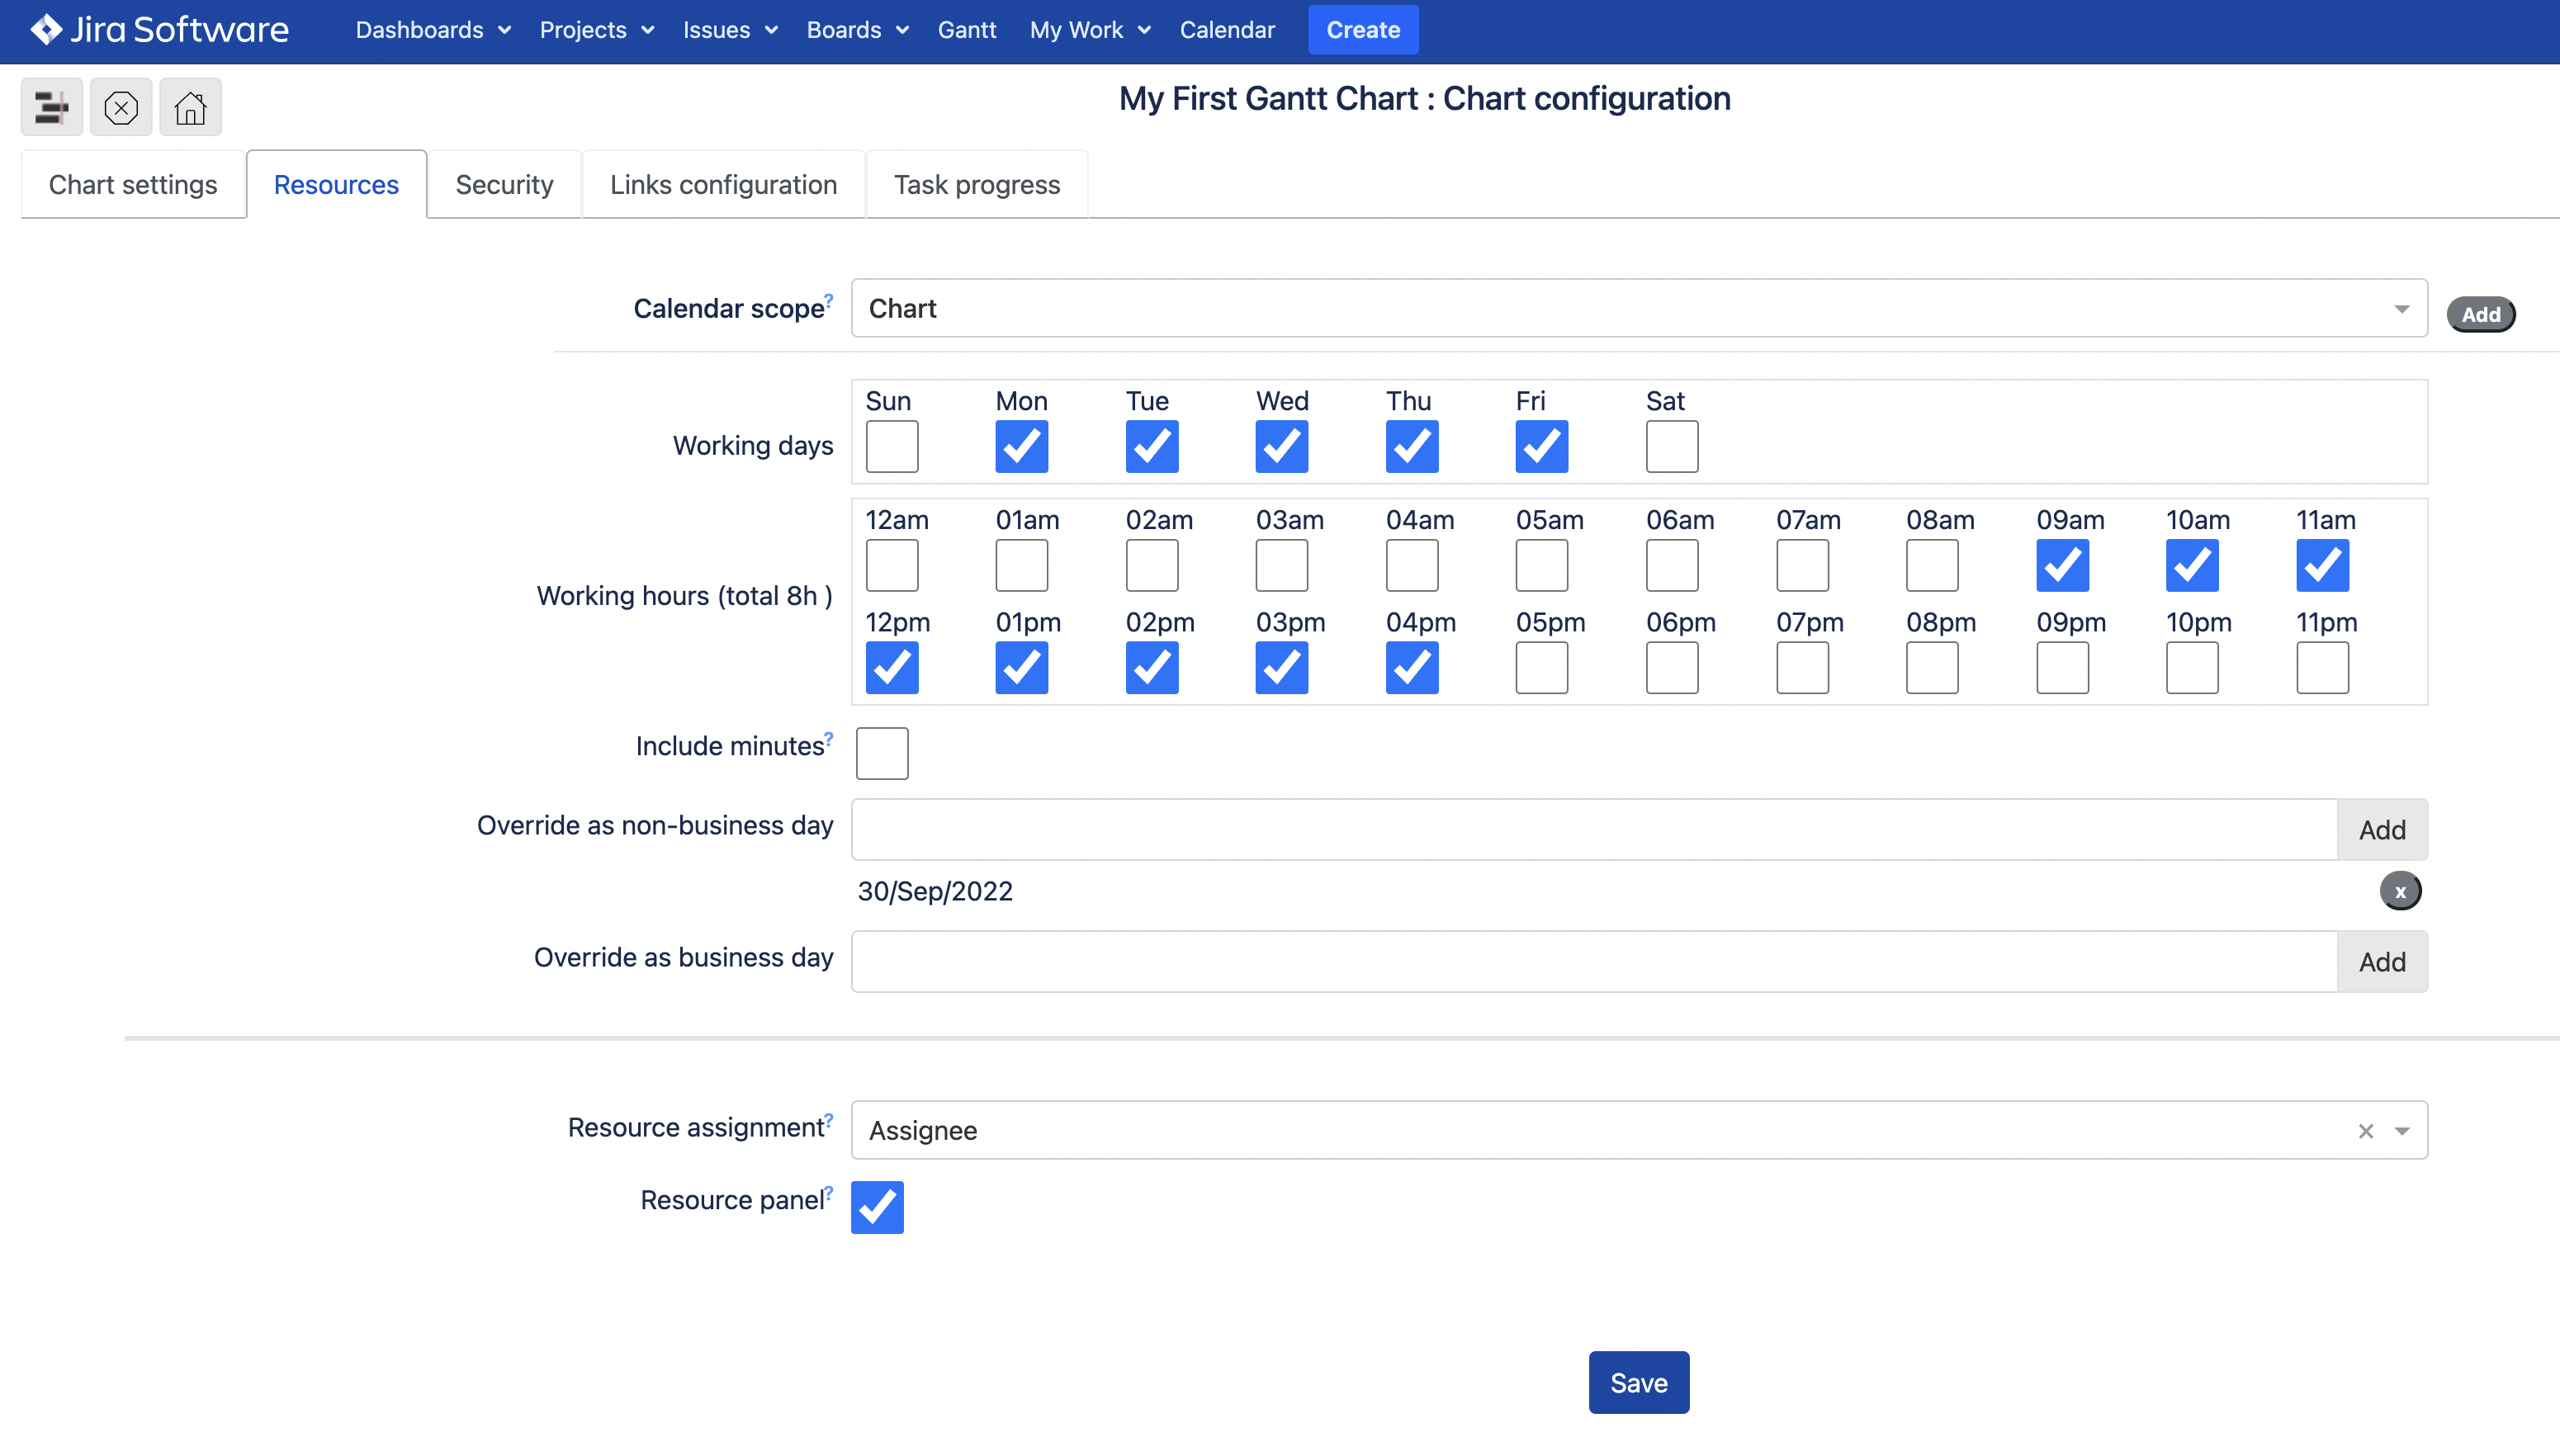
Resources tab
Here, you can define the working and non-working days and hours for your team in general as per individual resource by adding and configuring the individual resource calendars.
...
| Info |
|---|
By default, standard Jira field Assignee is used for a resource assignment. Although, any custom field with the type of User picker (single user) can be used for a resource assignment. |
  |
  |
| Tip |
|---|
If needed, the Resource panel can be hidden from Gantt chart display by unticking the Resource panel checkbox. |
| Tip |
|---|
Starting the app version 3.0.x, the Gantt Suite teams are available. |
In order to use a team assignment in Gantt chart, the field with the type of Short text (plain text only) has to be selected.
 |
Then, the teams have to be created and associated with the Gantt chart. This can be done by clicking the button Teams.
 |
More information regarding the team assignment can be found here: Team assignment.
Security tab
By default, created Gantt chart is public and accessible by all Jira users who are granted an access to the app.
As a chart manager, you can choose who can view or edit the chart by configuring the chart security roles.
  |
Links configuration tab
As a chart manager, you can also define the types of task dependencies to be displayed on Gantt chart.
 |
Task progress tab
Here, you can define the time tracking mode by selecting either Jira time tracking, custom estimate field or no time tracking option.
 |
In addition, you’ll be able to select a way to calculate task progress.
 |
Look and Feel tab
Starting the app version 3.0.x, the app users can create and apply the conditional colors to the tasks on a chart.
...
For
 |
Extended settings tab
The tab provides the ability to define the additional chart settings such as
 |
For more details, see Configuring a chart.
...
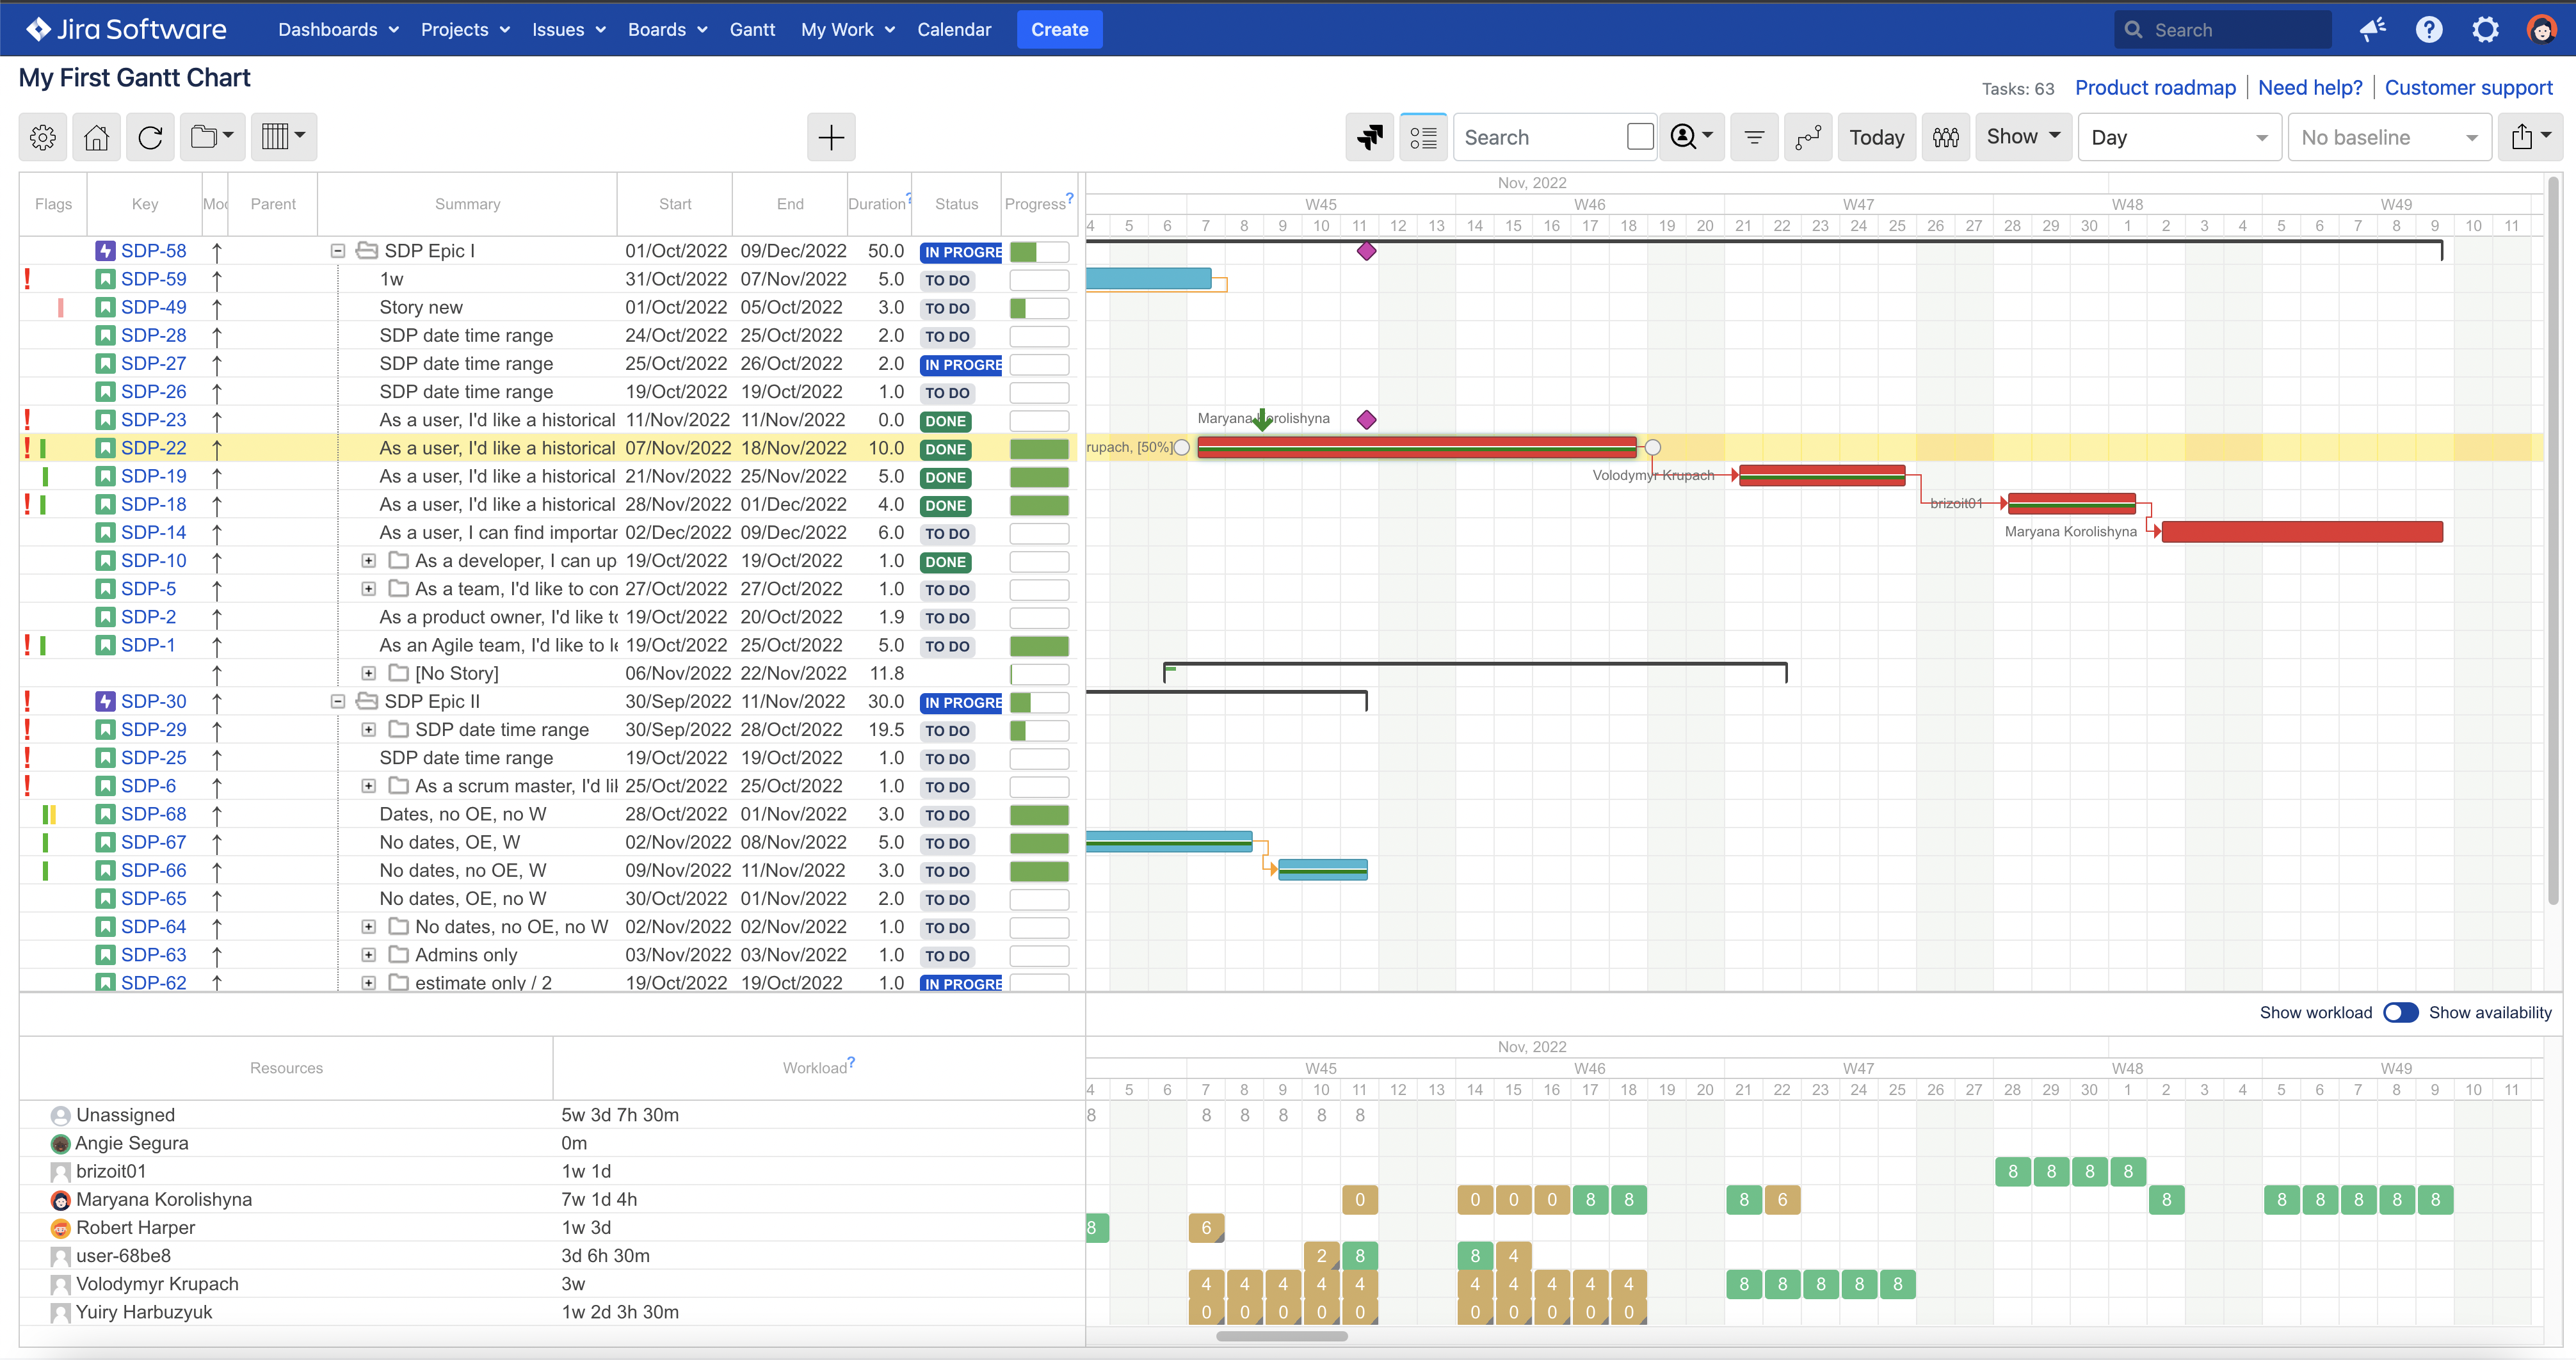
Once you open a Gantt chart, the task list is displayed on the left, inside left-side gridthe Table (1), the tasks themselves are displayed in timeline section Timeline (2), and resource workload/availability is displayed at the bottom, on the Resource panel (3). For details, see Working with a chart.
  |