...
 |
...
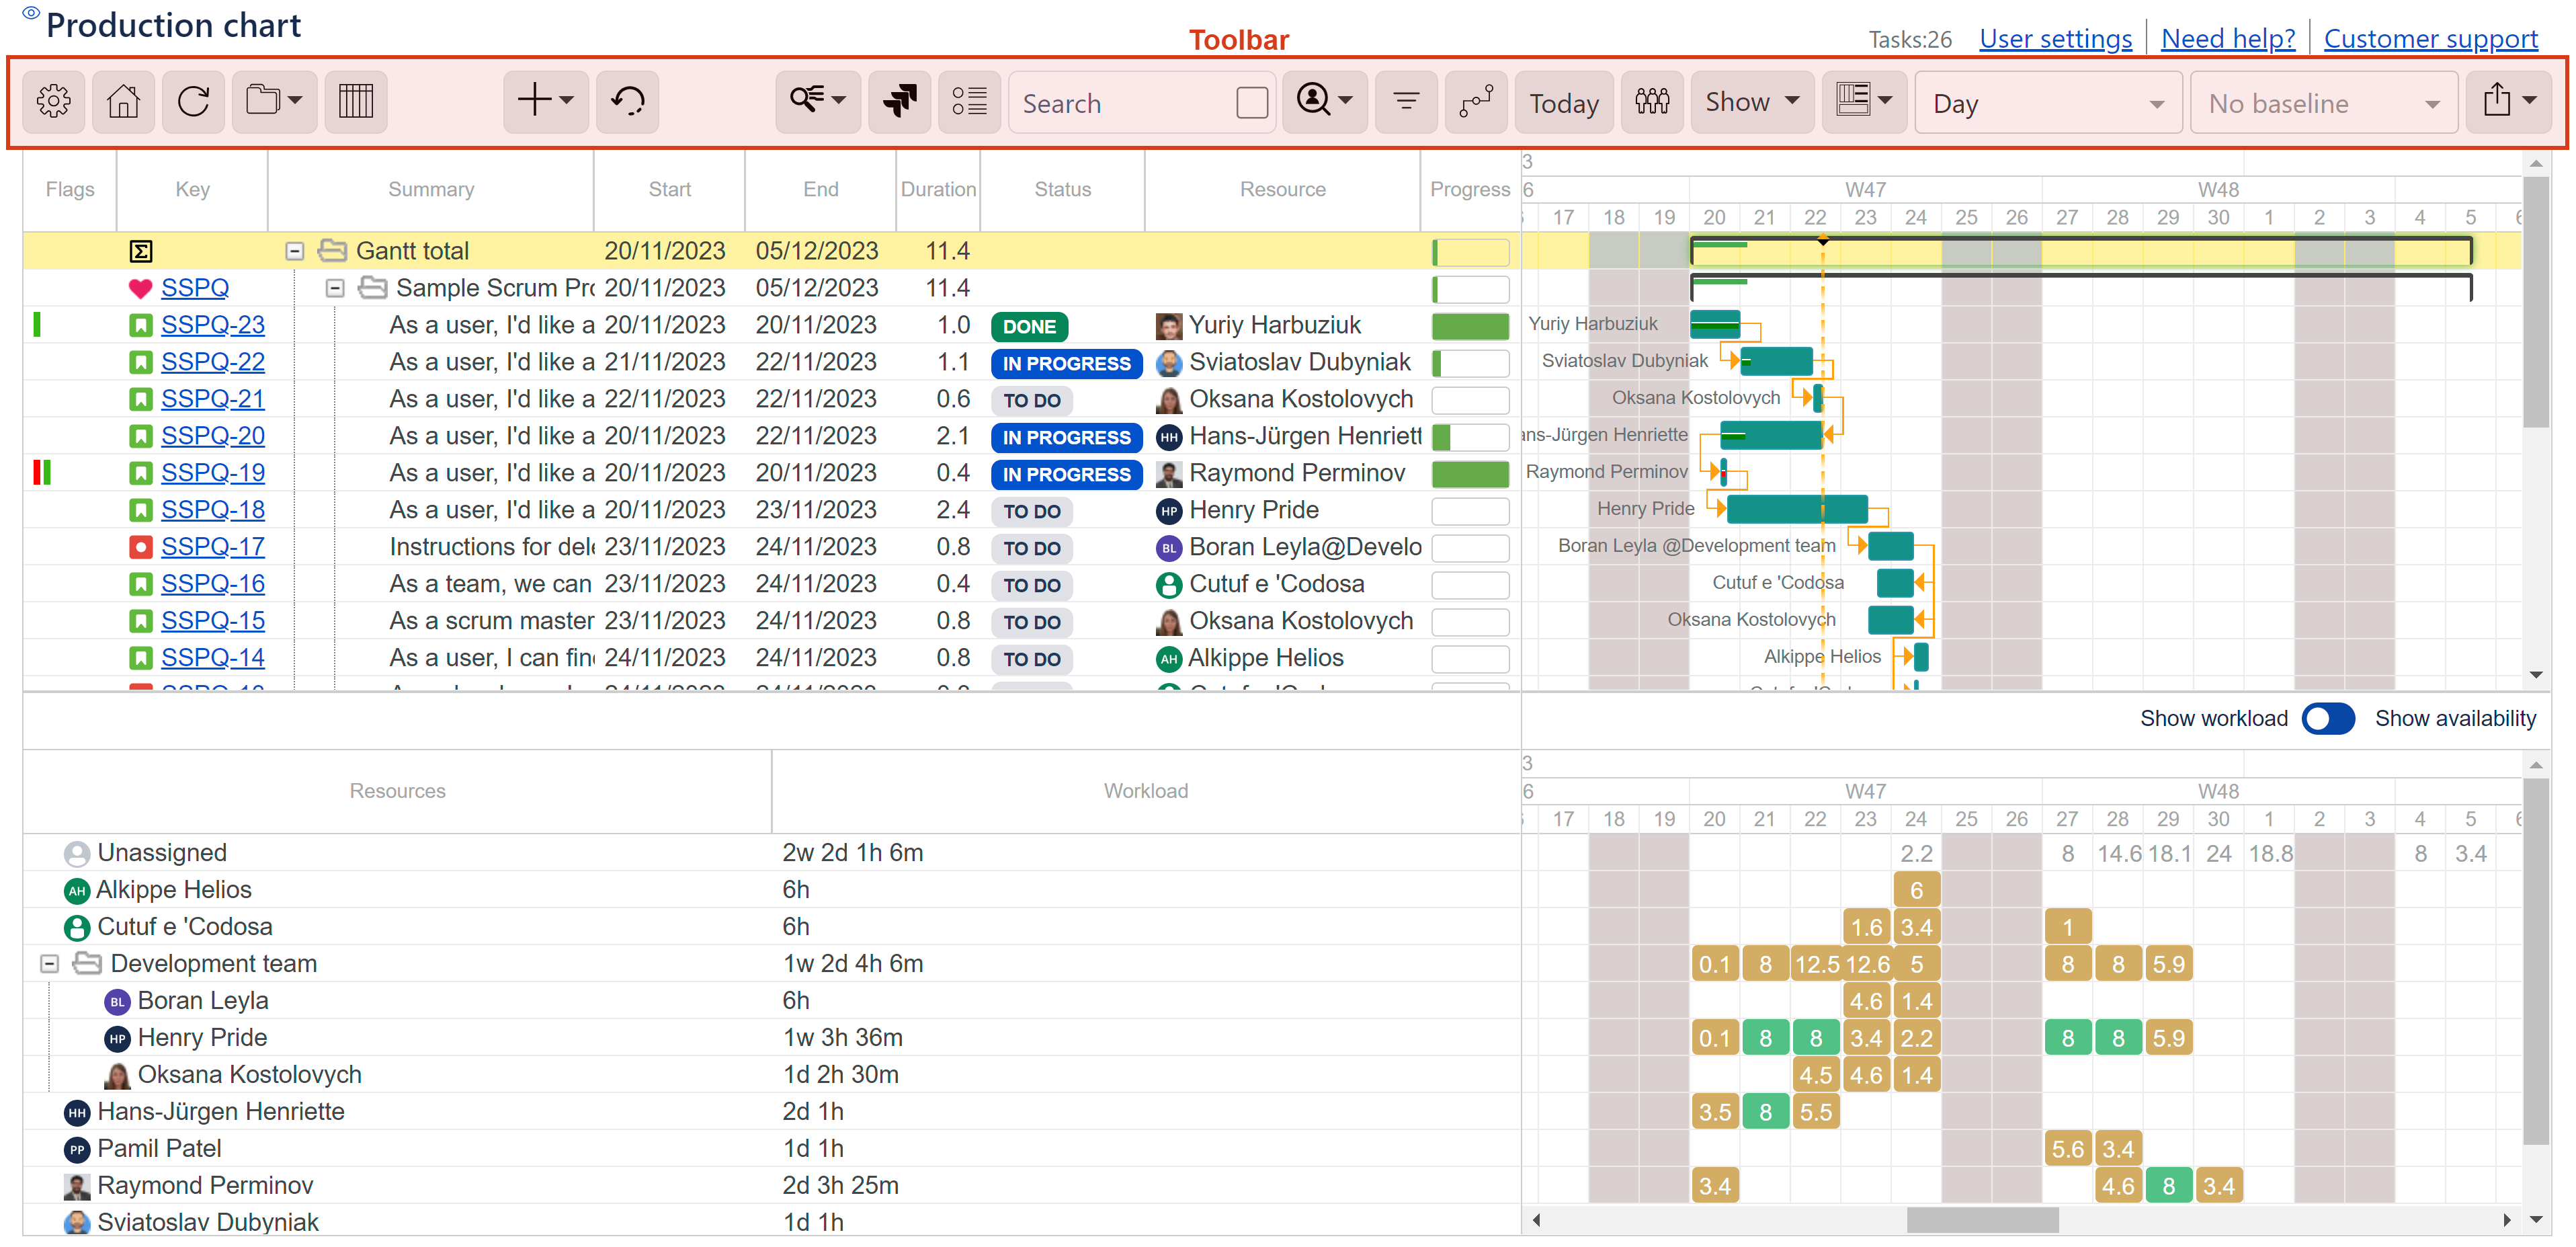
View/edit chart configuration
![]()
![]()
Chart home page/ list of charts
![]()
Refresh chart
![]()
![]()
Expand / collapse all tasks
![]()
Show or hide tasks grid (Task grid, left-side panel). ![]()
Select columns for the left-side grid.
...
| Note |
|---|
On exported to Excel chart, besides default standard fields, the additionally selected fields will be shown. Extra fields will not be shown on a chart shared with the public via URL or as embedded. |
![]()
![]()
Create and add a new Jira or internal task to the chart
![]()
Undo last actions
...
Create scenarios, review changes and switch between scenarios and Jira (Live)
![]()
Save parent task data to Jira
Use this button in case you want to update the Jira dates for parent tasks based on the dates that are displayed for parent tasks, on a chart.![]()
| Info |
|---|
The tasks that are in manual mode are not displayed on the dialog. |
![]()
Group tasks by selected Jira fields / Create chart hierarchy
...
Task search results may or may not include the task-children, depending on your preferences. To include the task-children to search results, simply, tick the checkbox within Search.
...
![]()
![]()
Filter tasks by assignees
...
Filter tasks by issue type
![]()
![]()
Filter tasks by issue status
![]()
![]()
Scroll to current date
^^^ Tasks grid ON
...
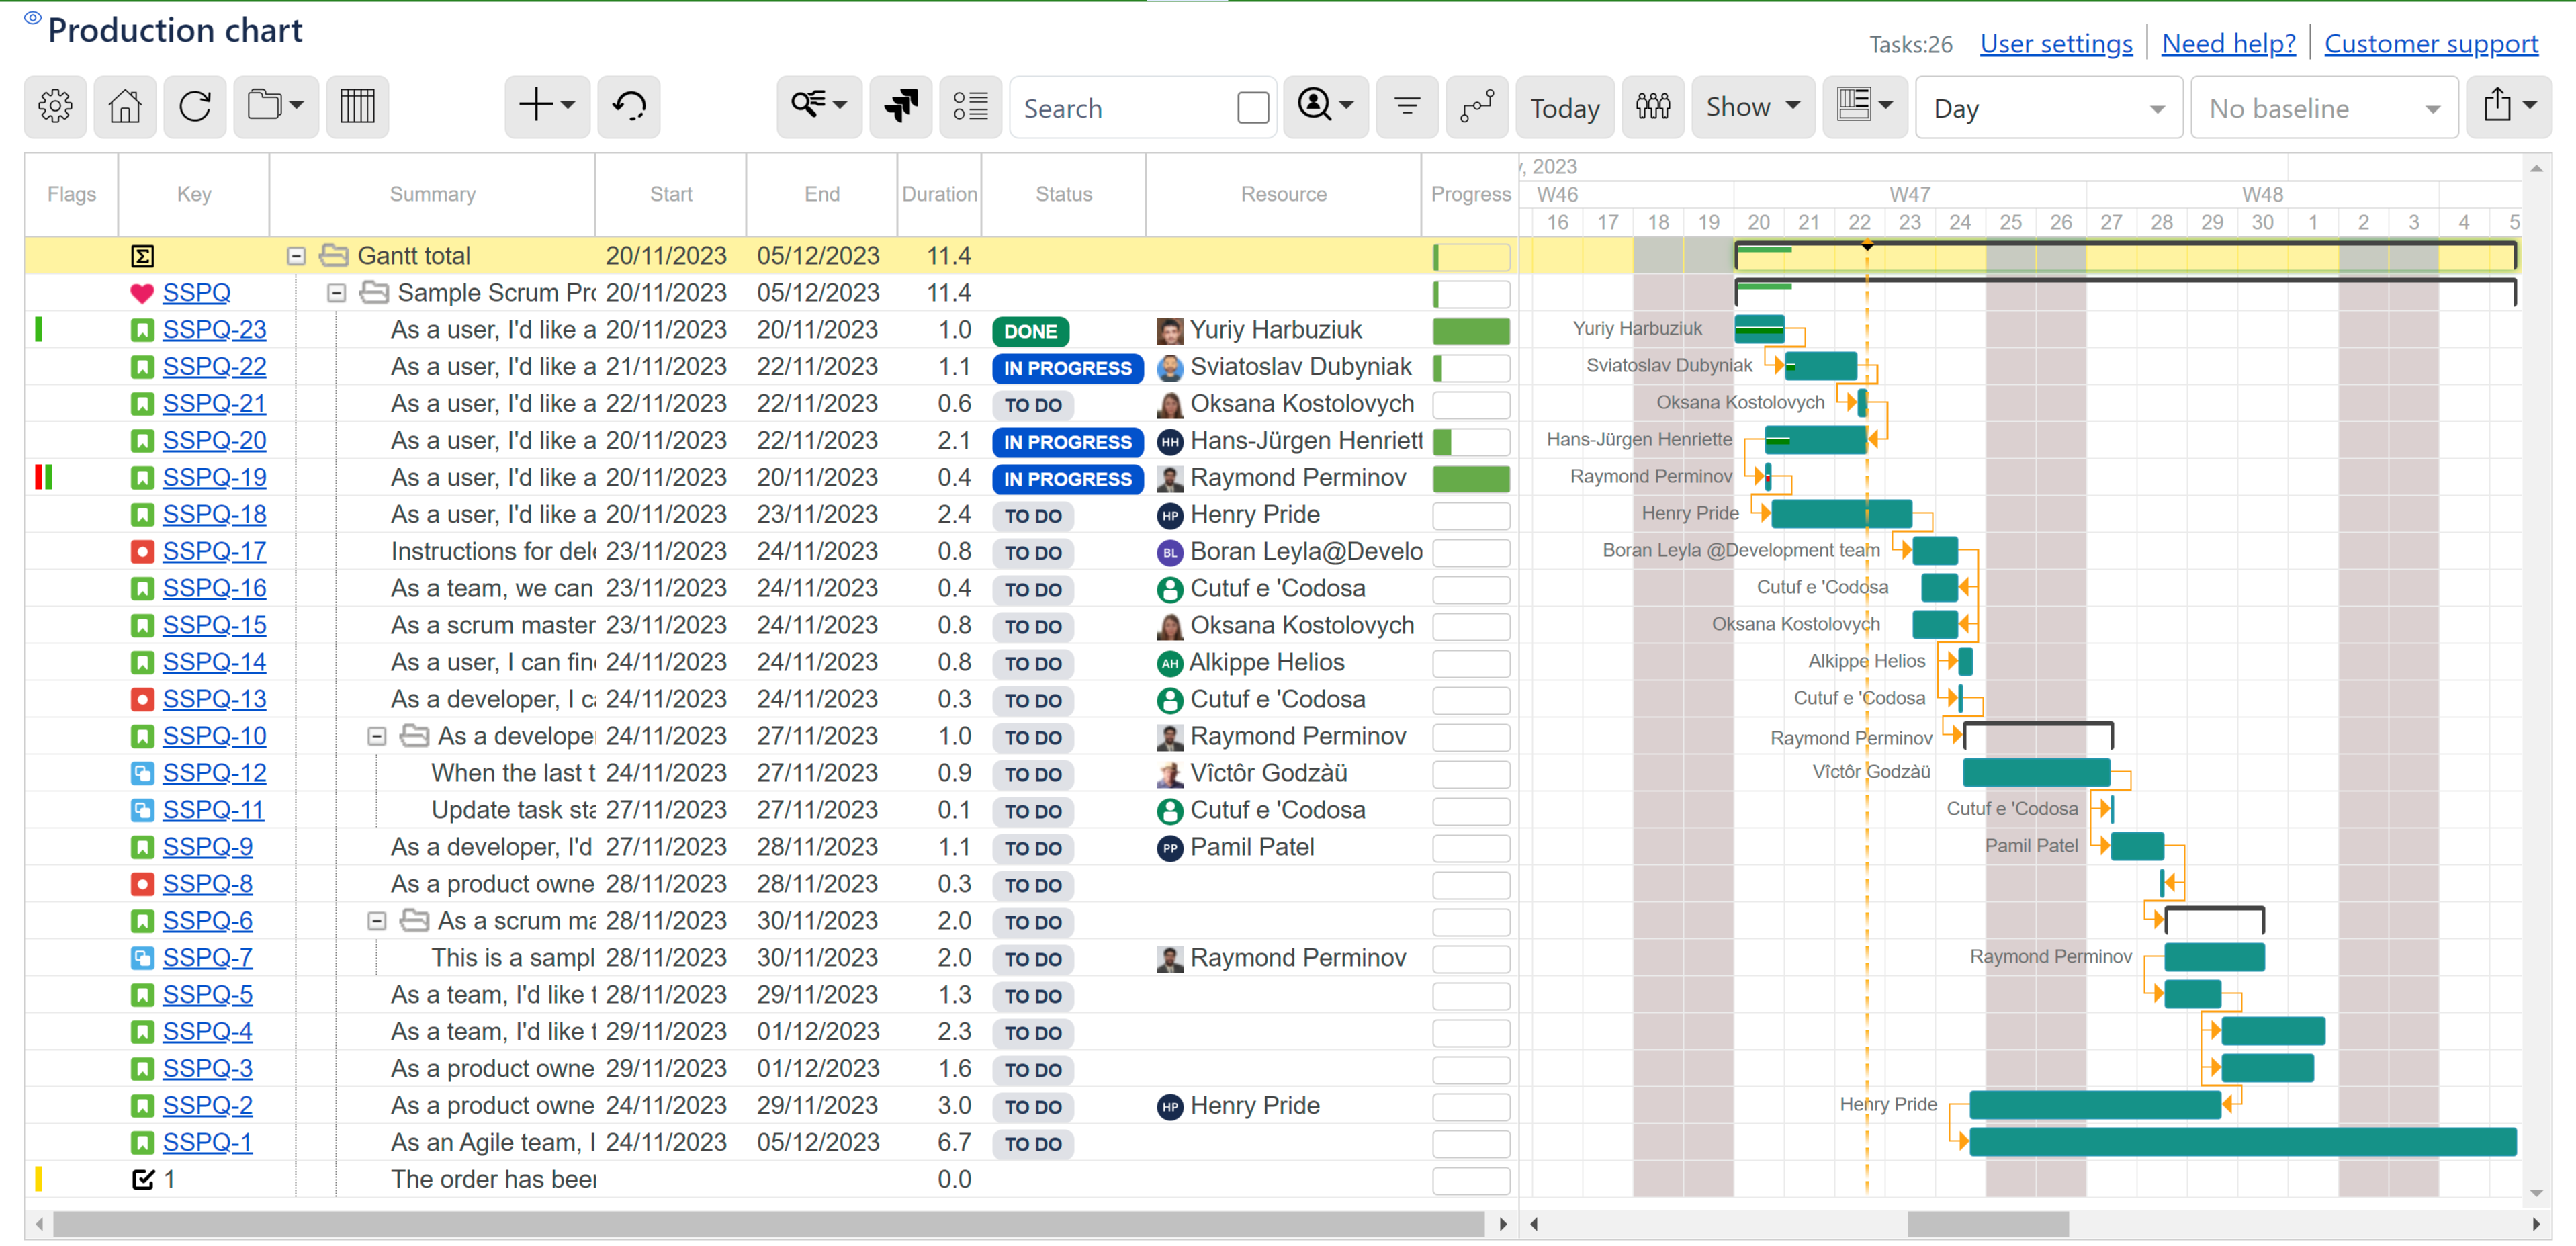
^^^ Tasks grid OFF
...
...
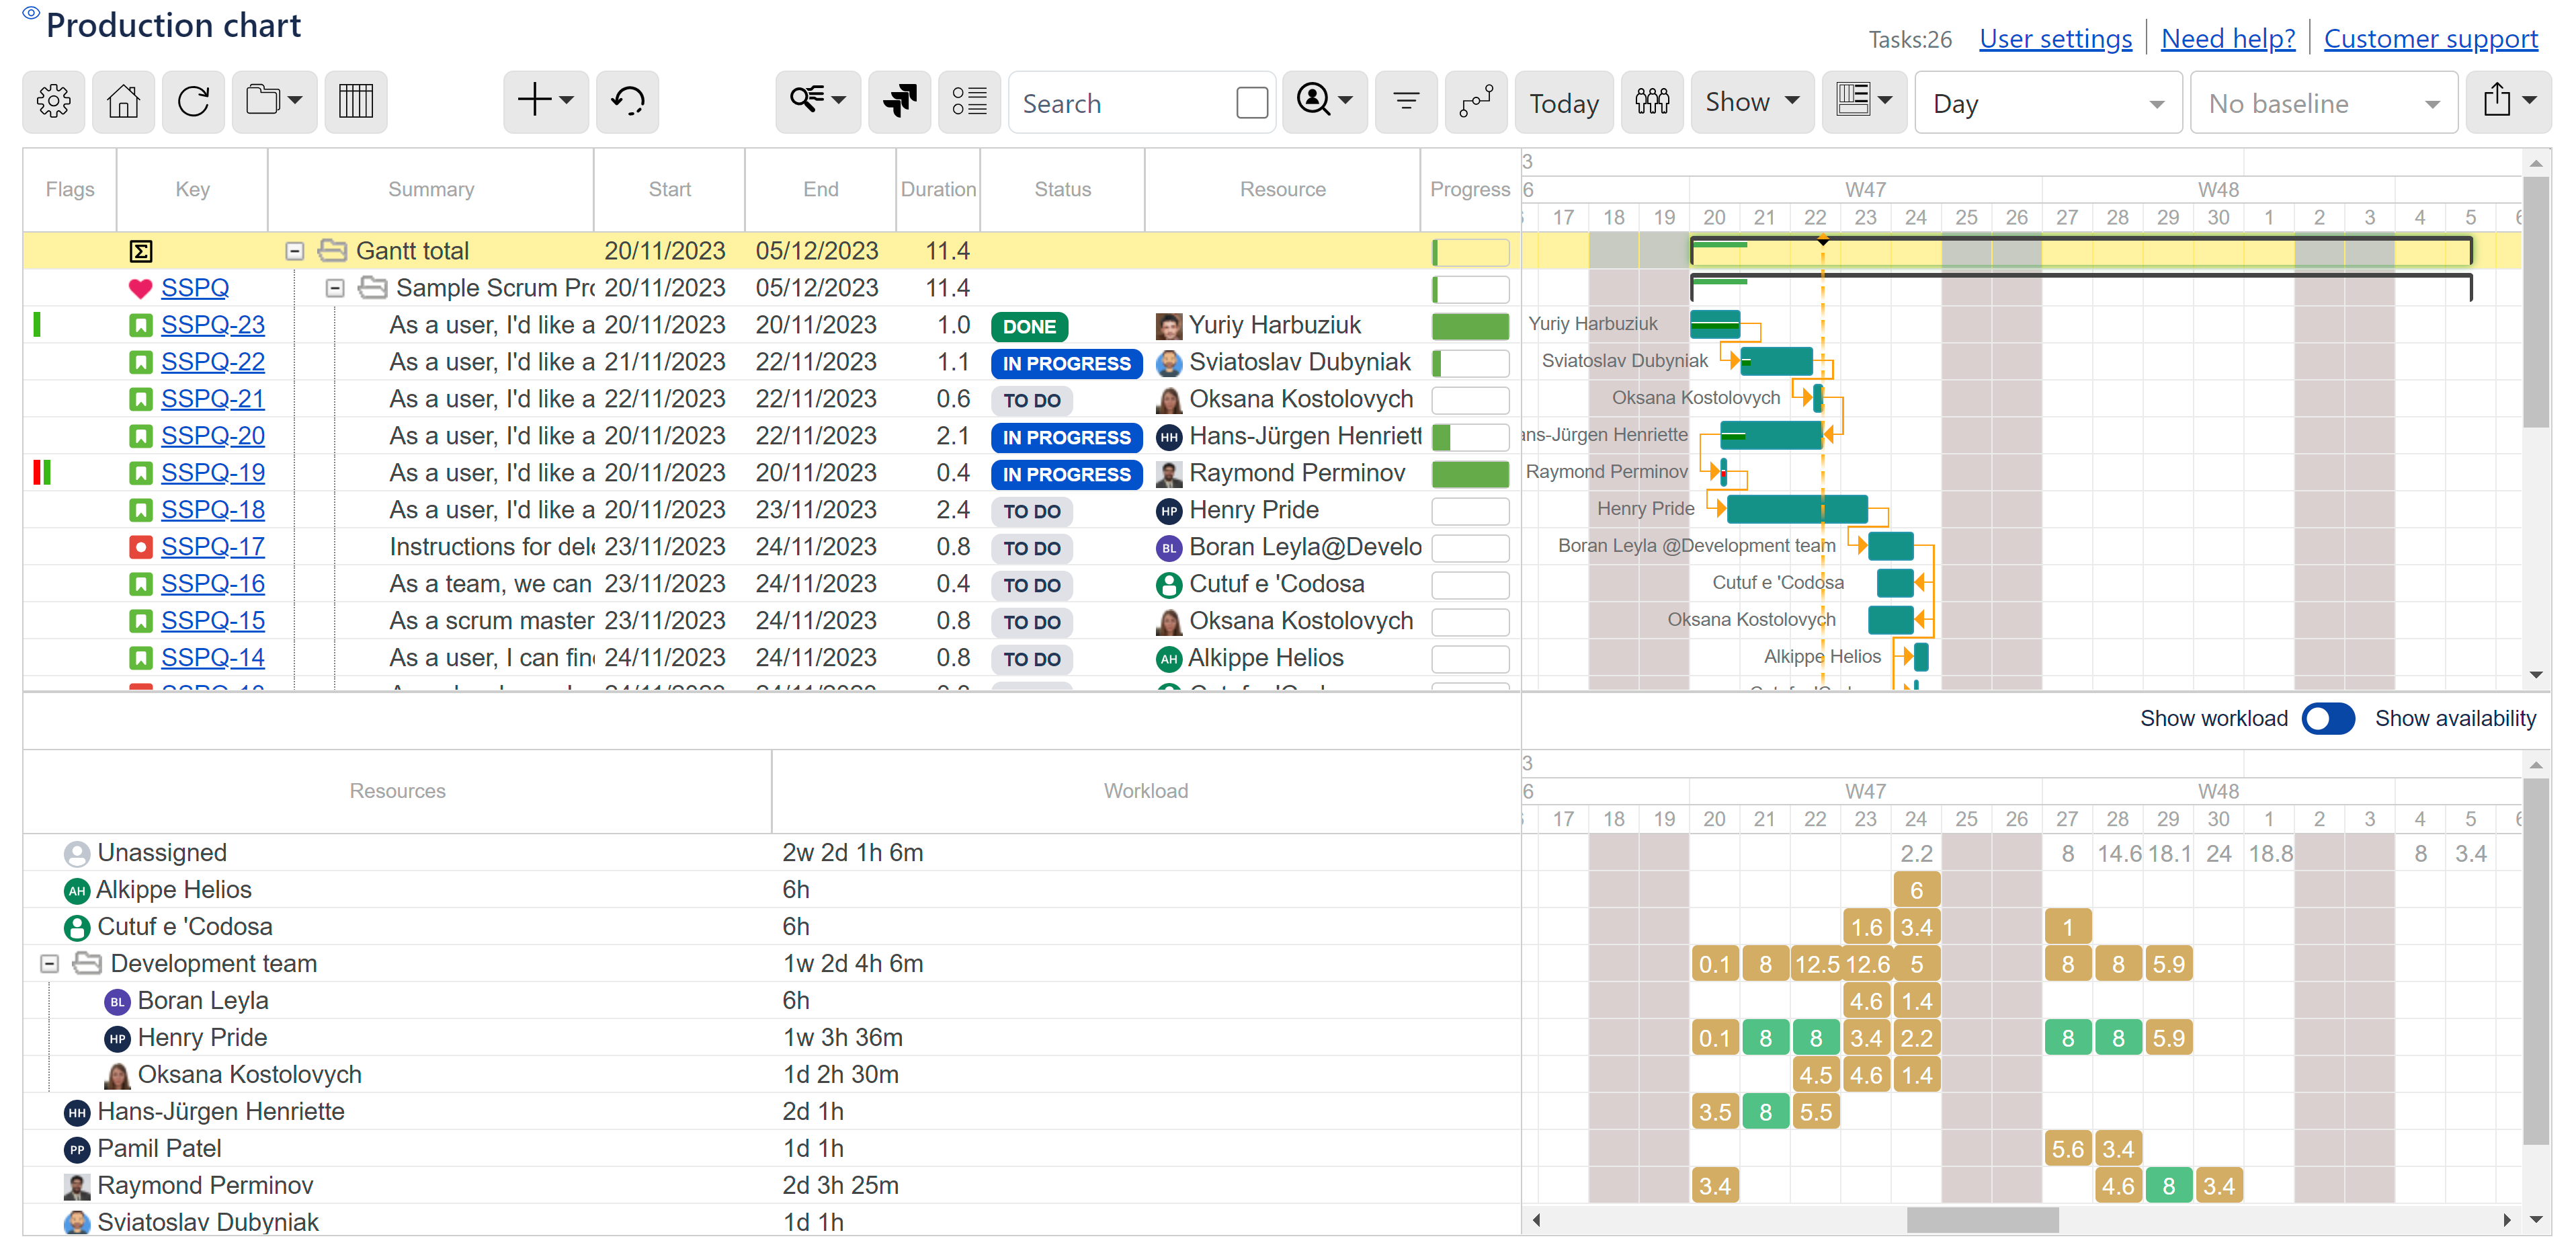
Show or hide resources (Resources, bottom panel)
...
 |
...
 |
...
...
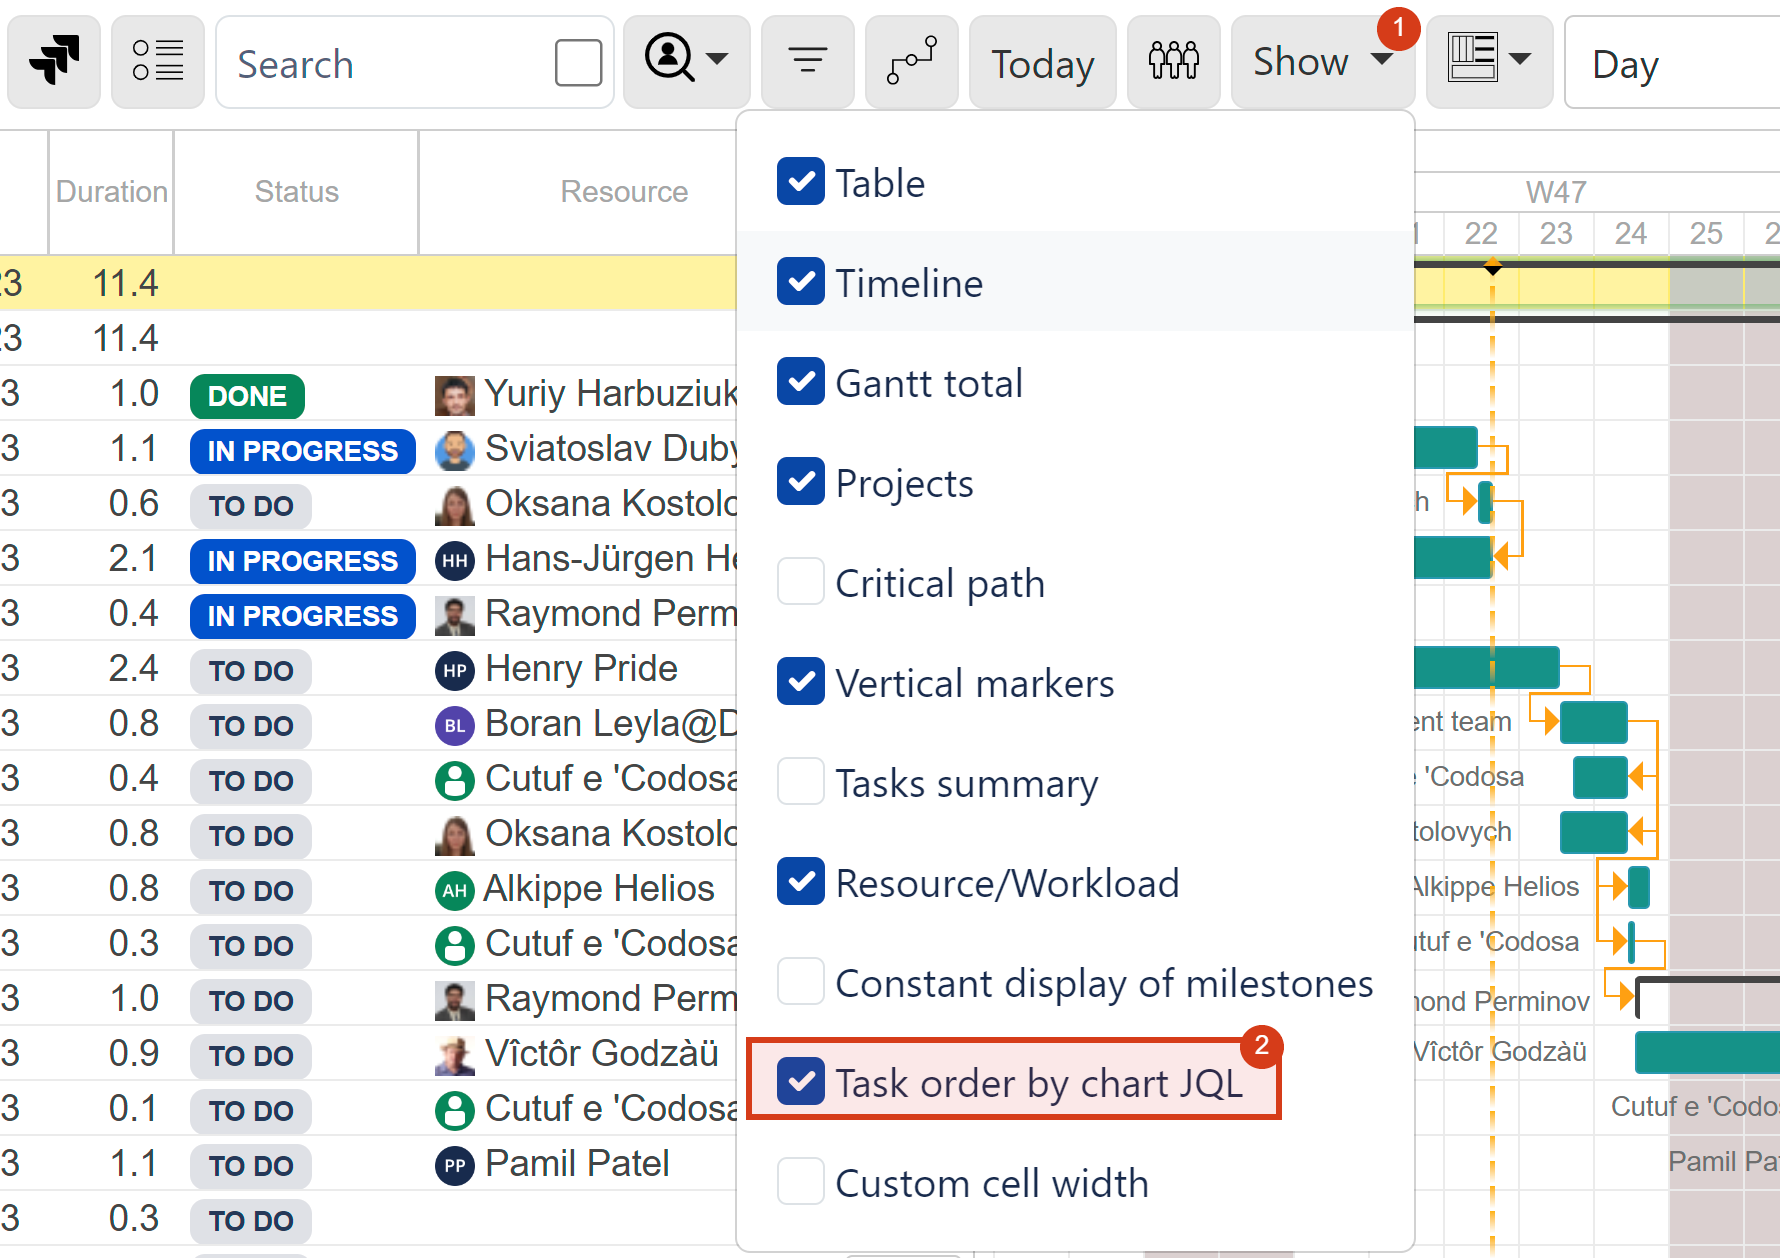
Toggle visibility of the elements on a chart (Show dropdown):
...
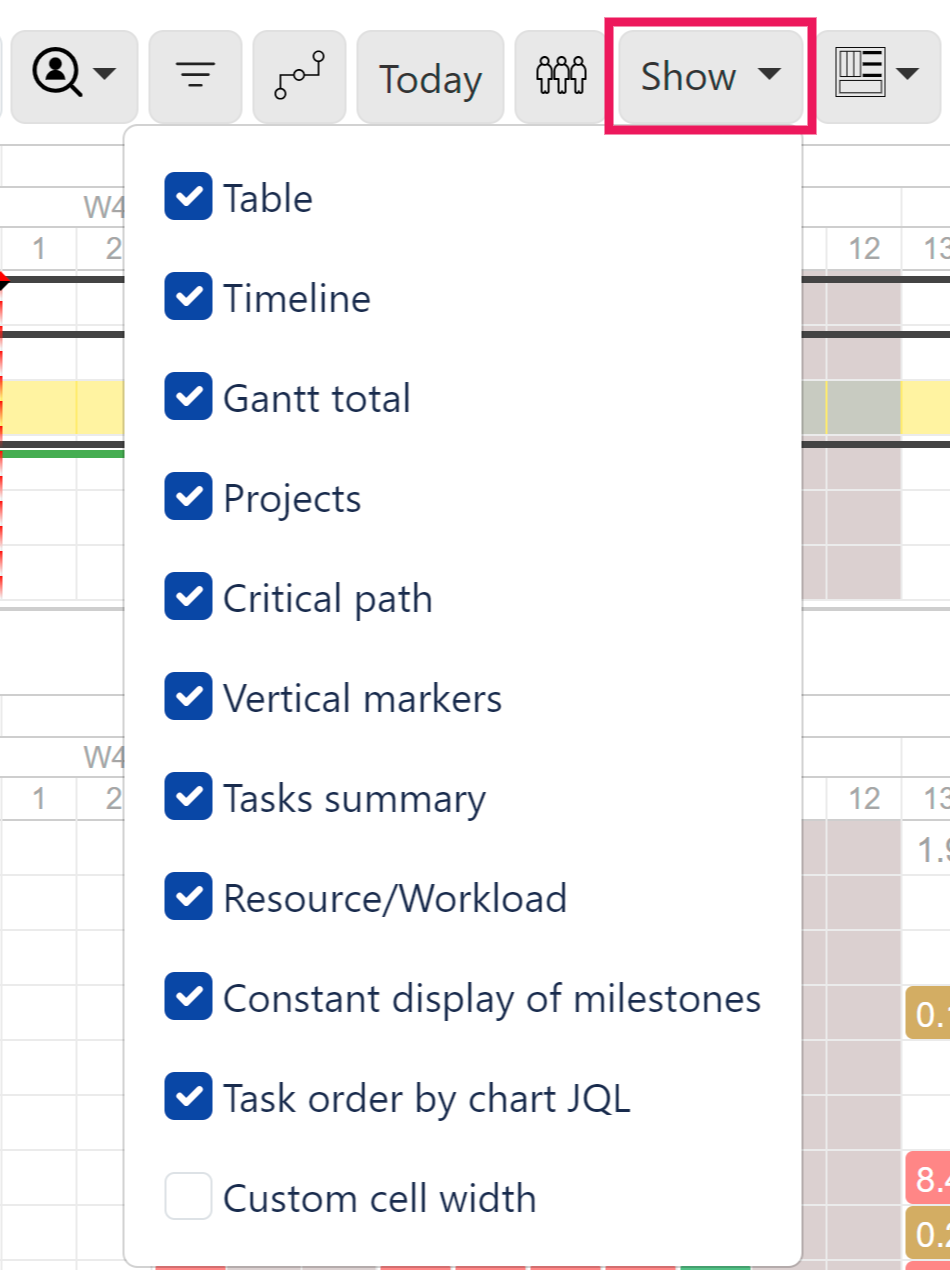 |
Show or hide the table (the list of tasks and configured columns)
Show or hide the timeline (bars and links area)
Show the total of all projects in the chart by enabling the Gantt total display
Tasks on critical path are highlighted in red when show critical path display is selectedenabled
Show or hide Today and release vertical markers (vertical orange lines on the today’s date and release dates)
Show or hide issue key and the task summary to the right of the task bar
Show or hide assigneeresource/workload to the left of the task bar*
Show tasks, according to chart JQL order
| Info |
|---|
*Note that assignee workload % for a task is shown in case the task work and task duration differ. |
...
When Constant display of milestones is marked, milestones will be shown on parent tasks too (will roll up). This allows to see milestones on top levels even if the whole tree is collapsed. In example below, the milestone is shown on a collapsed project because Constant display of milestones is marked.
...
Show tasks sorted by a grid column, or sorted according to order defined in the chart JQL
| Tip |
|---|
Did you know you can set the initial task order according to chart JQL order even though you may have reordered the tasks on a chart? Assuming there is an ‘order by’ clause in chart JQL, you can reset the tasks according to the JQL provided in chart configuration. Simply click Initial task Task order by chart JQL under Show menu. |
...
 |
| Tip |
|---|
Did you know you can hover over a marker to see what it stands for? By default, the marker names are hidden. Just hover over the marker’s top to reveal its meaning. |
...
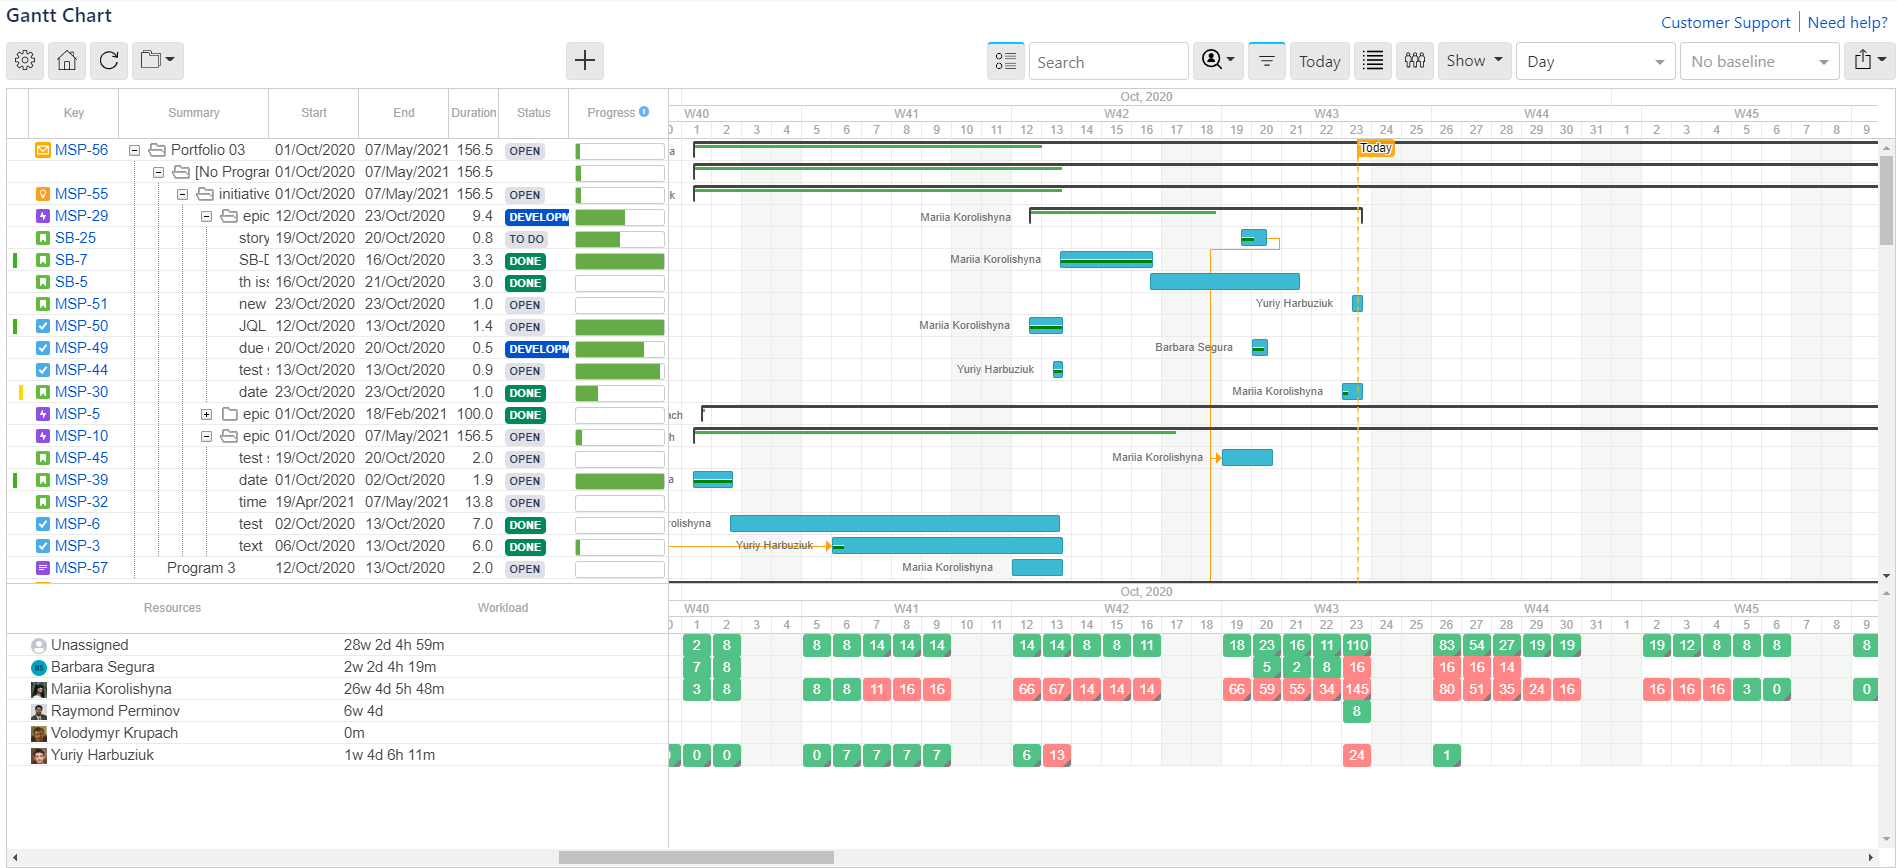
Gantt total
Users can now see the total of multiple projects configured for the chart by enabling the Gantt total display under the Show menu.
...
![]()
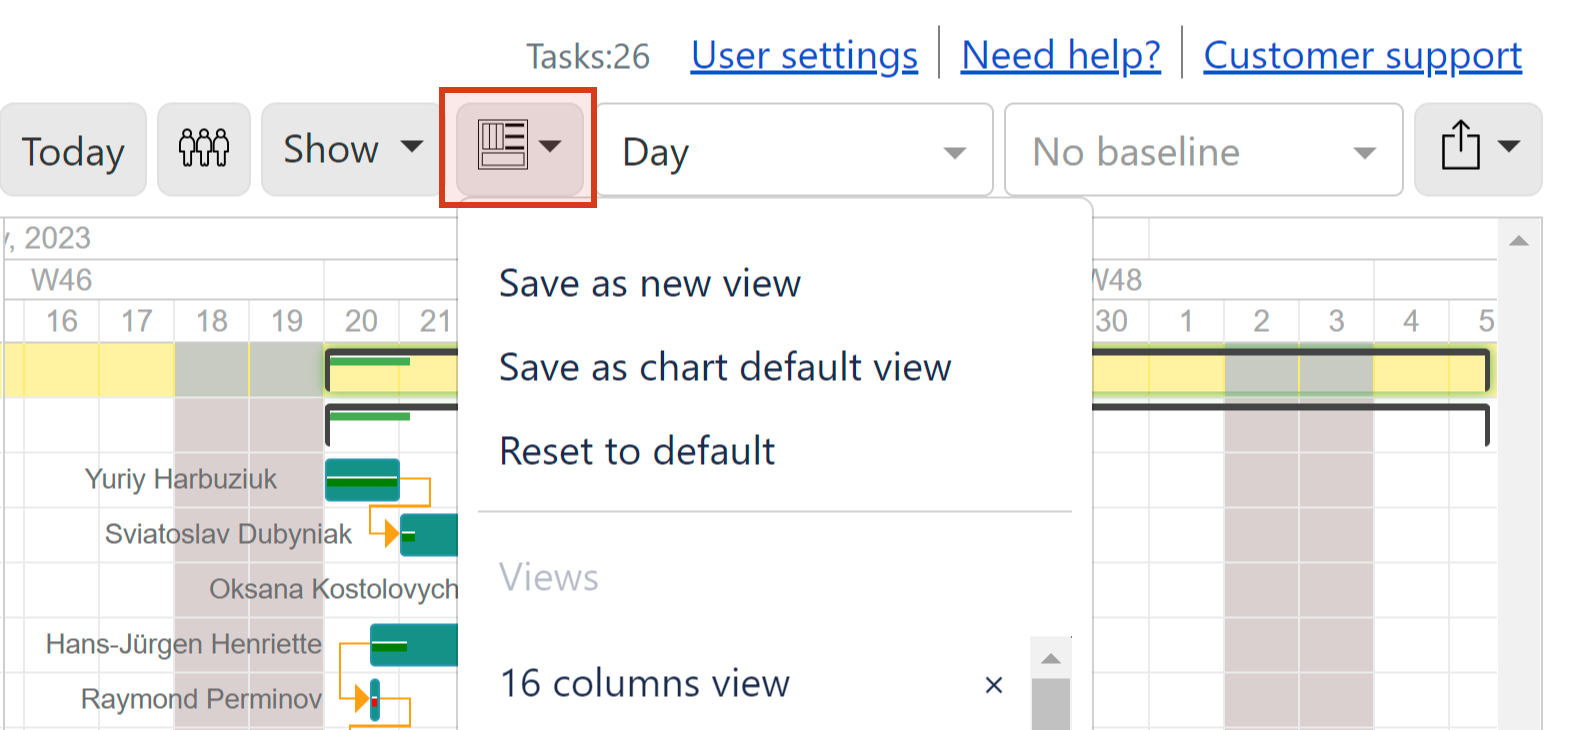
Views
Save multiple customized Gantt chart views to apply them any time you need.
 |
...
Set timeline and resources scale. Timeline and resources cell range will change depending on a selected scale.
...
Hour scale allows to set duration in minutes
...
Other scales allow to set duration in days
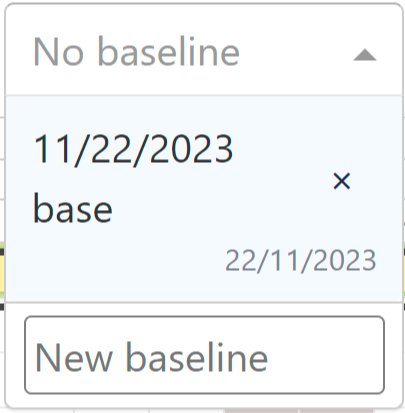
Select or create a baseline for the chart.
Details: Working with baselines
...