|

...
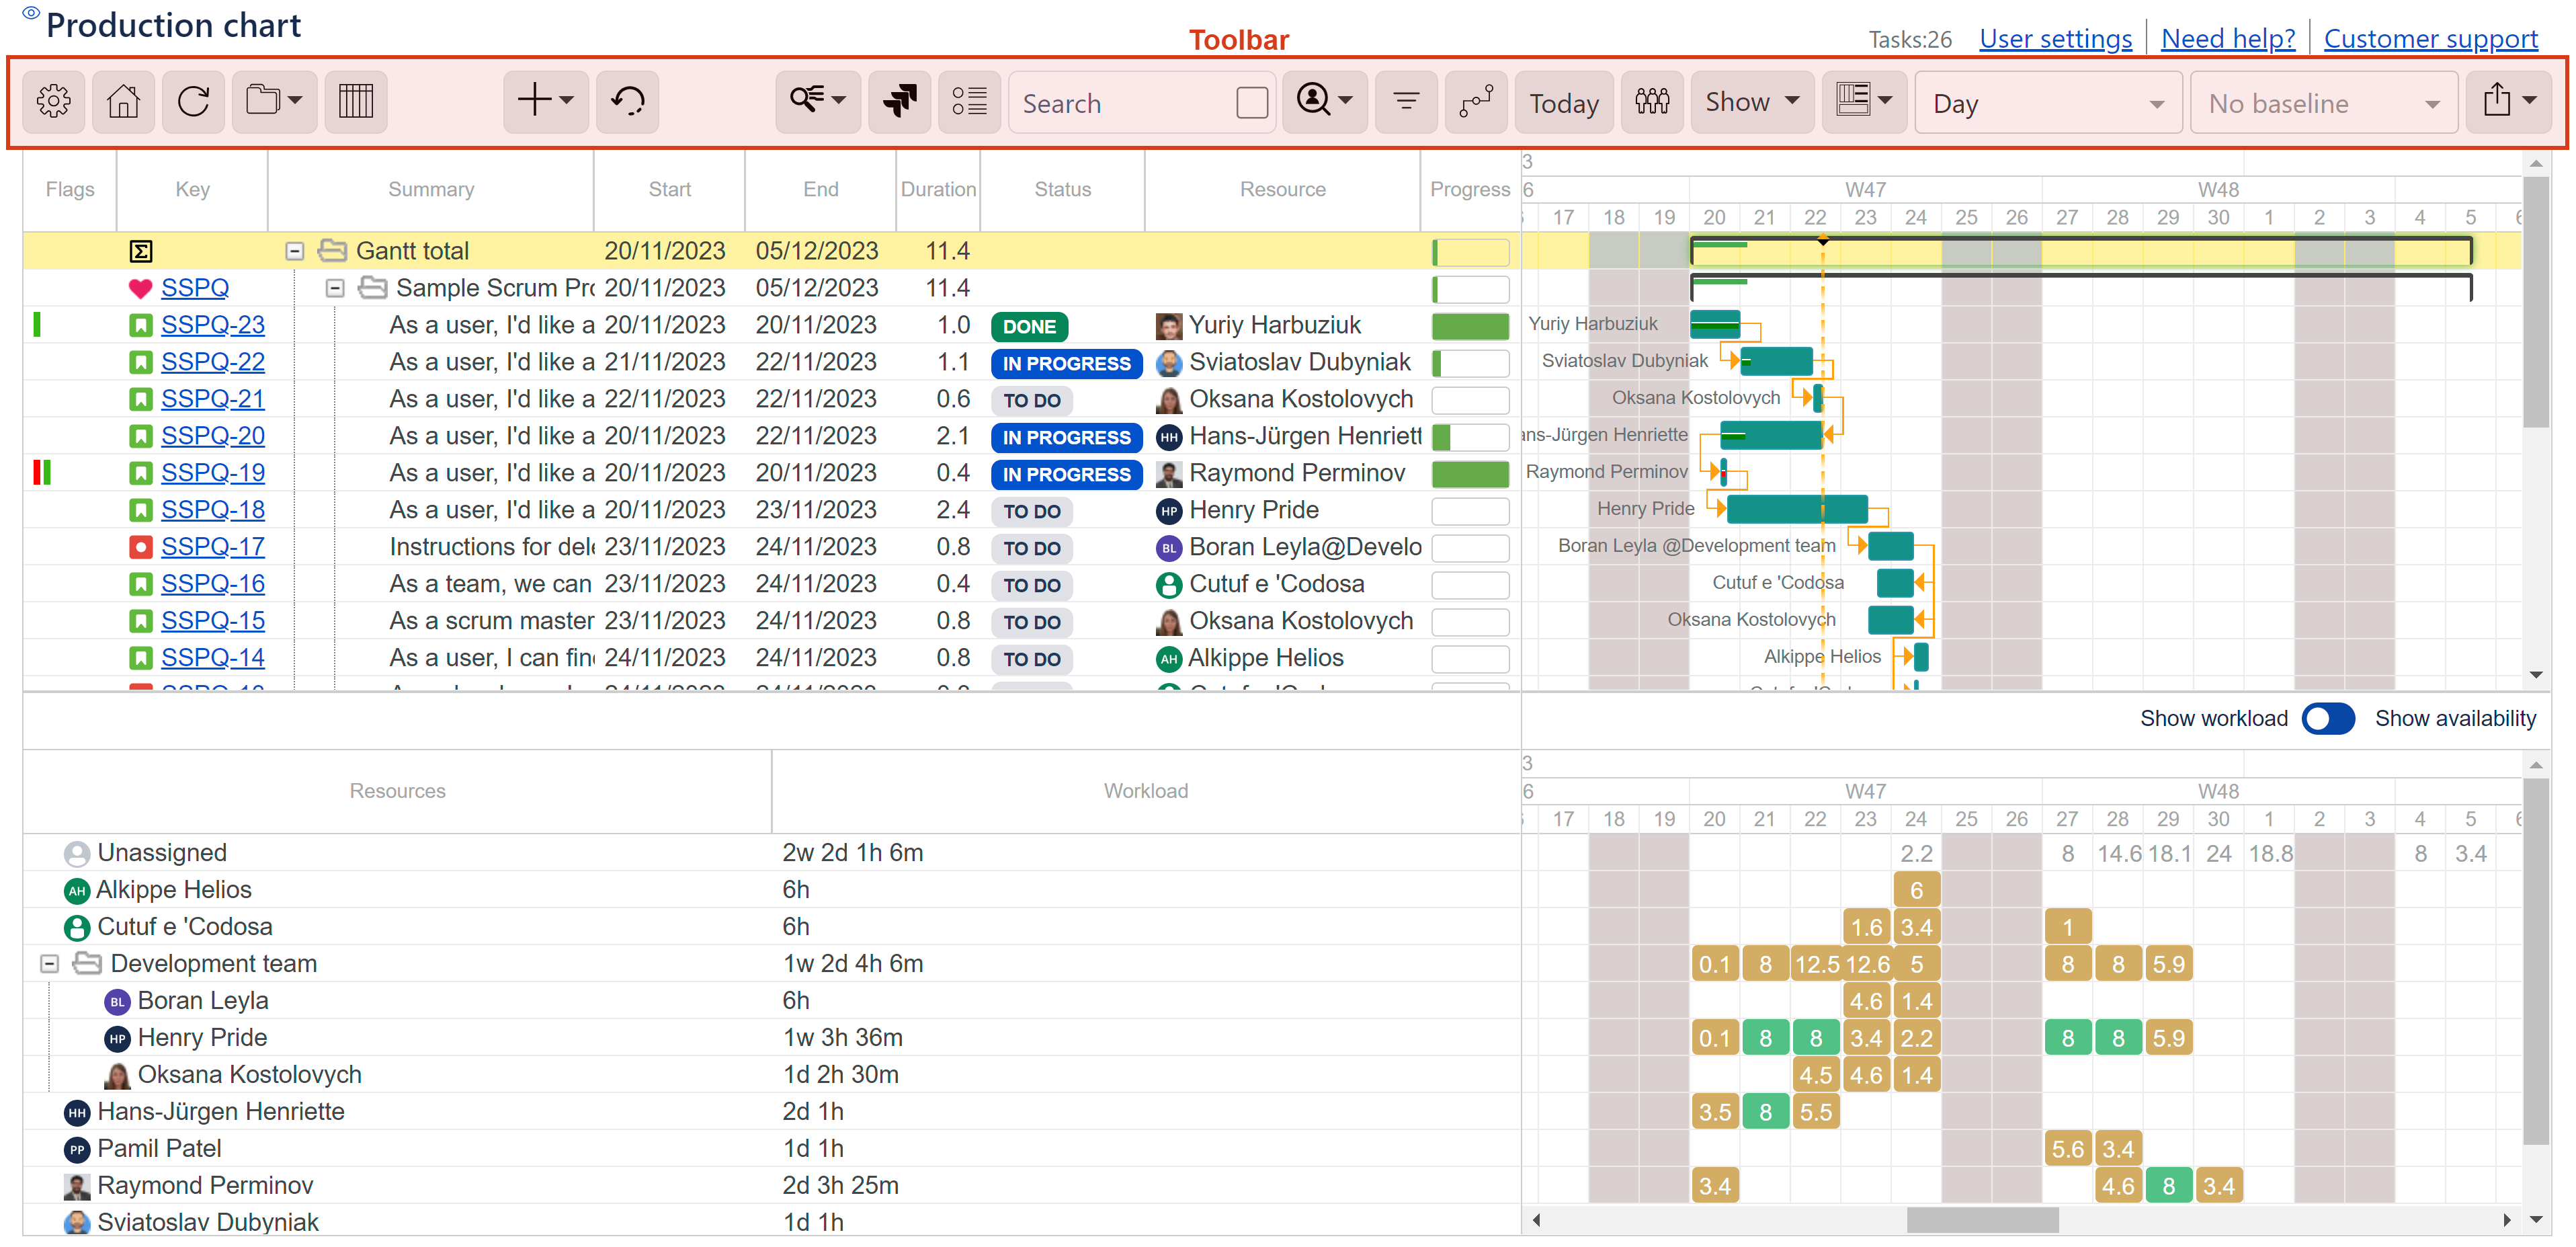
View/edit chart configuration
...
Users can select which fields they want to be shown as columns on the left-side grid. In addition, they can achieve the desired column order by drag-and-dropping selected fields in the dialog.
| Tip |
|---|
Starting the app version 5.0, Gantt chart tree can be presented by the column Key instead of column Summary (default). |
...
|

| Note |
|---|
On exported to Excel chart, besides default standard fields, the additionally selected fields will be shown. Extra fields will not be shown on a chart shared with the public via URL or as embedded. |
...
Create and add a new Jira or internal task to the chart
![]()
 Undo last actions
...
Create scenarios, review changes and switch between scenarios and Jira (Live)
 Check chart health
| Tip |
|---|
Starting the app version 5.0, all chart issues can be tracked in one place, on the Chart health dialog. It is accessible via the Check chart health button on the toolbar. |
A user can be redirected to the problematic task in a single click using the ‘Show task on the chart’ button.
 |
By default, the chart issues are divided into 5 categories. Click the ‘Select categories to display button’ to hide or reorder the categories, if necessary. In addition, the starting date, finish date or time range can be selected to filter the tasks in the dialog.
...
| Info |
|---|
What’s more, the conflicts resolution caused by “remaining work distribution“ has moved to the ‘Work completion’ category of the dialog. You can resolve the issue directly on the dialog using the ‘Set the end date equal to calculated’ button. |
 |
![]()
Save parent task data to Jira
...
Task search results may or may not include the task-children, depending on your preferences. To include the task-children to search results, simply, tick the checkbox within Search.
...
![]()
Filter tasks by assignees
![]()
Filter tasks by issue type
![]()
Filter tasks by issue status Show or hide Filter panel
In the app version 5.0, task filtering functionality went through major makeover. The old filters such as ‘Filter by issue type’, ‘Filter by resource’ and ‘Filter by status’ are replaced by more advanced filters. Now, users can filter the tasks either by Gantt / Jira fields, or by JQL.
![]()
Scroll to current date
...
Show or hide resources (Resources, bottom panel)
...
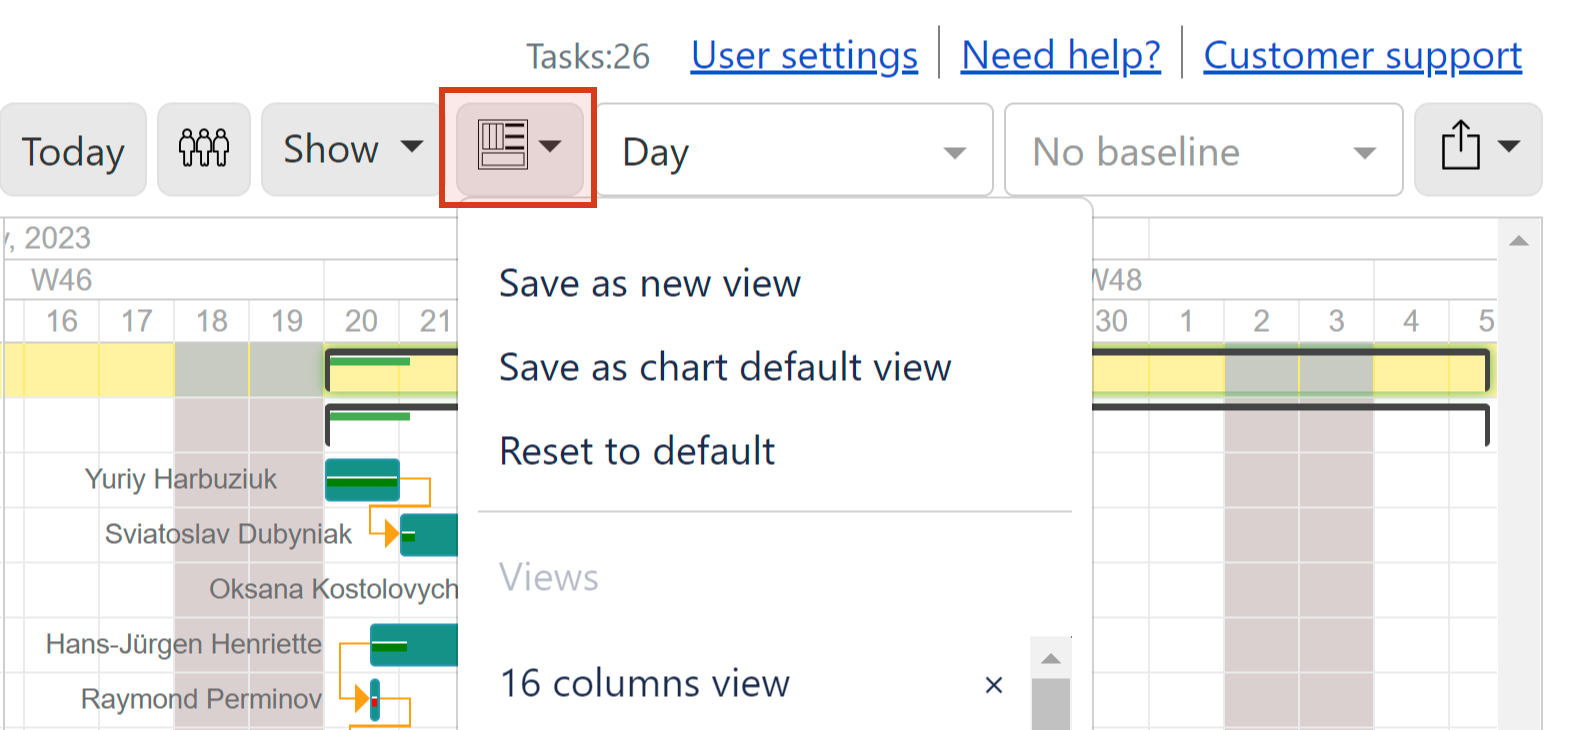
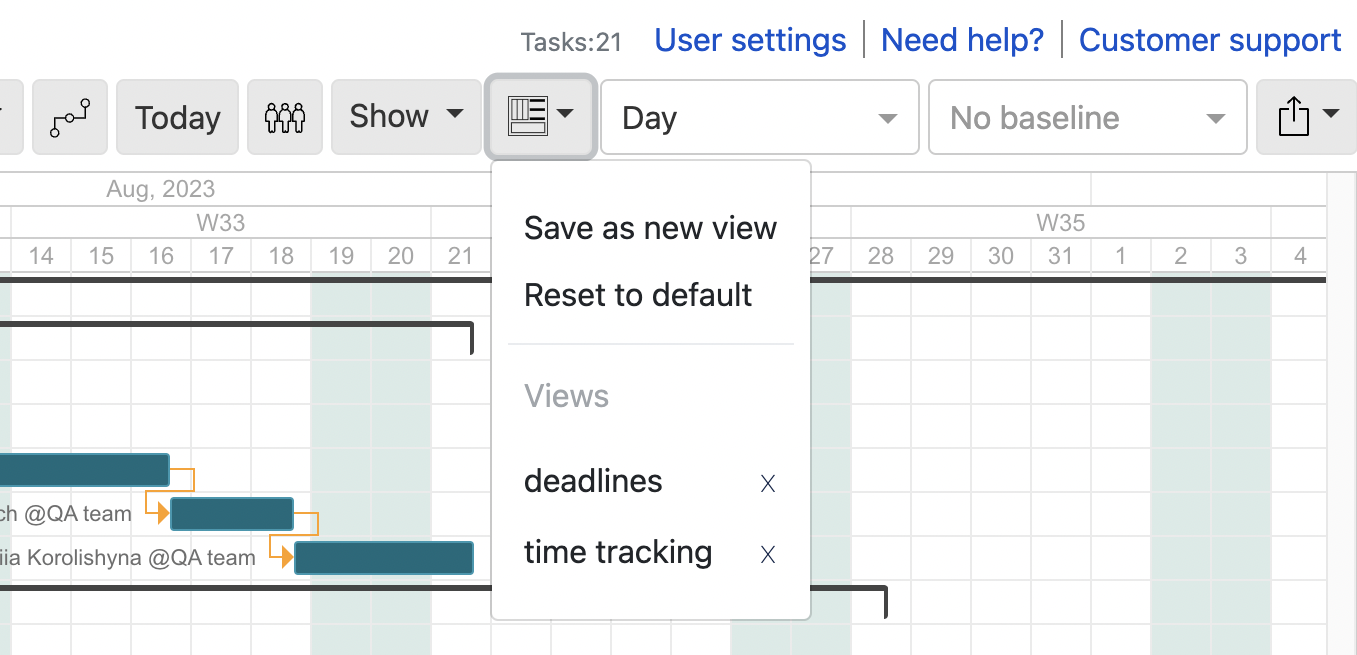
Save multiple customized Gantt chart views to apply them any time you need.
  |
...
Set timeline and resources scale. Timeline and resources cell range will change depending on a selected scale.
...
Hour scale allows to set duration in minutes
...
Other scales allow to set duration in days
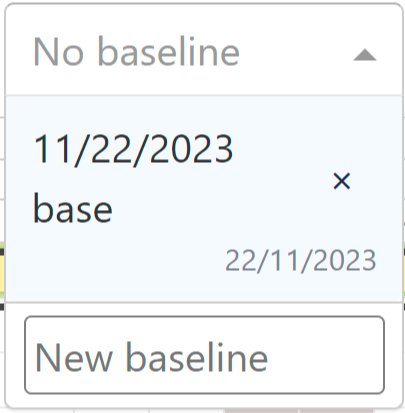
Select or create a baseline for the chart.
Details: Working with baselines
...